I wrote a couple weeks ago about the importance of attribution as a guide for artificial intelligence-driven marketing. One implication was I should pay more attention to attribution systems. Here’s a quick look at two products that tackle different parts of the attribution problem: content measurement and advertising measurement.
TrenDemon
Let’s start with TrenDemon. Its specialty is measuring the impact of marketing content on long B2B sales cycles. It does this by placing a tag on client Web sites to identify visitors and track the content they consume, and then connecting client CRM systems to find which visitor companies ultimately made a purchase (or reached some other user-specified goal). Visitors are identified by company using their IP address and as individuals by tracking cookies.
TrenDemon does a bit more than correlate content consumption and final outcomes. It also identifies when each piece of content is consumed, distinguishing between the start, middle, and end of the buying journey. It also looks at other content metrics such as how many people read an item, how much time they spend with it, and how many read something else after they’re done. These and other inputs are combined to generate an attribution score for each item. The system uses the score to identify the most effective items for each journey stage and to recommend which items should be presented in the future.
Pricing for TrenDemon starts at $800 per month. The system was launched in early 2015 and is currently used by just over 100 companies.
Adinton
Next we have Adinton, a Barcelona-based firm that specializes in attribution for paid search and social ads. Adinton has more than 55 clients throughout Europe, mostly selling travel and insurance online. Such purchases often involve multiple Web site visits but still have a shorter buying cycle than complex B2B transactions.
Adinton has pixels to capture Web ad impressions as well as Web site visits. Like TrenDemon, it tracks site visitors over time and distinguishes between starting, middle, and finishing clicks. It also distinguishes between attributed and assisted conversions. When possible, it builds a unified picture of each visitor across devices and channels.
The system uses this data to calculate the cost of different types of click types, which it combines to create a “true” cost per action for each ad purchase. It compares this with the clients’ target cost per actions to determine where they are over- or under-investing.
Adinton has API connections to gather data from Google AdWords, Facebook Ads, Bing Ads, AdRoll, RocketFuel, and other advertising channels. An autobidding system can currently adjust bids in AdWords and will add Facebook and Bing adjustments in the near future. The system also does keyword research and click fraud identification. Pricing is based on number of clicks and starts as low as $299 per month for attribution analysis, with additional fees for autobidding and click fraud modules. Adinton was founded in 2013. It launched its first product in 2014 although attribution came later.
Further Thoughts
These two products are chosen almost at random, so I wouldn’t assign any global significance to their features. But it’s still intriguing that both add a first/middle/last buying stage to the analysis. It’s also interesting that they occupy a middle ground between totally arbitrary attribution methodologies, such as first touch/last touch/fractional credit, and advanced algorithmic methods that attempt to calculate the true incremental impact of each touch. (Note that neither TrenDemon nor Adinton’s summary metric is presented as estimating incremental value.)
Of course, without true incremental value, neither system can claim to develop an optimal spending allocation. One interpretation might be that few marketers are ready for a full-blown algorithmic approach but many are open to something more than the clearly-arbitrary methods. So perhaps systems like TrenDemon and Adinton offer a transitional stage for marketers (and marketing AI systems) that will eventually move to a more advanced approach.
An alternative view would be the algorithmic methods will never be reliable enough to be widely accepted. This would see these intermediate systems as about as far as most marketers ever will or should go towards measuring marketing program impact. Time will tell.
Showing posts with label marketing analytics. Show all posts
Showing posts with label marketing analytics. Show all posts
Monday, November 06, 2017


Friday, October 14, 2016
Datorama Applies Machine Intelligence to Speed Marketing Analytics
As I mentioned a couple of posts back, I’ve been surveying the borders of Customer Data Platform-land recently, trying to figure out which vendors fit within the category and which do not. Naturally, there are cases where the answer isn’t clear. Datorama is one of them.
At first glance, you’d think Datorama is definitely not a CDP: it positions itself as a “marketing analytics platform” and makes clear that its primary clients are agencies, publishers, and corporate marketers who want to measure advertising performance. But the company also calls itself a “marketing integration engine” that works with “all of your data”, which certainly goes beyond just advertising. Dig a bit deeper and the confusion just grows: the company works mostly with aggregated performance data, but also works with some individual-level data. It doesn’t currently do identity resolution to build unified customer profiles, but is moving in that direction. And it integrates with advertising and Web analytics data on one hand and social listening, marketing automation, and CRM on the other. So while Datorama wasn’t built to be a CDP – because unified customer profiles are the core CDP feature – it may be evolving towards one.
This isn't to say that Datorama lacks focus. The system was introduced in 2012 and now has over 2,000 clients, including brands, agencies, and publishers. It grew by solving a very specific problem: the challenges that advertisers and publishers face in combining information about ad placements and results. Its solution was to automate every step of the marketing measurement process as much as it could, using machine intelligence to identify information within new data sources, map those to a standard data model, present the results in dashboards, and uncover opportunities for improvement. In other words, Datorama gives marketers one system for everything from data ingestion to consolidation to delivery to analytics. This lets them manage a process that would otherwise require many different products and lots of technical support. That approach – putting marketers in control by giving them a system pre-tailored to their needs – is very much the CDP strategy.
Paradoxically, the main result of Datorama’s specialization is flexibility. The system’s developers set of goal of handling any data source, which led to a system that can ingest nearly any database type, API feed or file format, including JSON and XML; automatically identify the contents of each field; and map the fields to the standard data model. Datorama keeps track of what it learns about common source systems, like Facebook, Adobe Analytics, or AppNexus, making it better at mapping those sources for future implementations. It can also clean, transform, classify, and reformat the inputs to make them more usable, applying advanced features like rules, formulas, and sentiment analysis. At the other end of the process, machine learning builds predictive models to do things like estimate lifetime value and forecast campaign results. The results can be displayed in Datorama’s own interface, read by business intelligence products like Tableau, or exported to other systems like marketing automation.
Datorama’s extensive use of machine learning lets it speed up the marketing analytics process while reducing the cost. But this is still not a push-button solution. The vendor says a typical proof of concept usually takes about one month, and it takes another one to two months more to convert the proof of concept into a production deployment. That’s faster than your father’s data warehouse but not like adding an app to your iPhone. Pricing is also non-trivial: a small company will pay in the five figures for a year’s service and a large company's bill could reach into seven figures. Fees are based on data volume and number of users. Datorama can also provide services to help users get set up or to run the system for them if they prefer.
At first glance, you’d think Datorama is definitely not a CDP: it positions itself as a “marketing analytics platform” and makes clear that its primary clients are agencies, publishers, and corporate marketers who want to measure advertising performance. But the company also calls itself a “marketing integration engine” that works with “all of your data”, which certainly goes beyond just advertising. Dig a bit deeper and the confusion just grows: the company works mostly with aggregated performance data, but also works with some individual-level data. It doesn’t currently do identity resolution to build unified customer profiles, but is moving in that direction. And it integrates with advertising and Web analytics data on one hand and social listening, marketing automation, and CRM on the other. So while Datorama wasn’t built to be a CDP – because unified customer profiles are the core CDP feature – it may be evolving towards one.
This isn't to say that Datorama lacks focus. The system was introduced in 2012 and now has over 2,000 clients, including brands, agencies, and publishers. It grew by solving a very specific problem: the challenges that advertisers and publishers face in combining information about ad placements and results. Its solution was to automate every step of the marketing measurement process as much as it could, using machine intelligence to identify information within new data sources, map those to a standard data model, present the results in dashboards, and uncover opportunities for improvement. In other words, Datorama gives marketers one system for everything from data ingestion to consolidation to delivery to analytics. This lets them manage a process that would otherwise require many different products and lots of technical support. That approach – putting marketers in control by giving them a system pre-tailored to their needs – is very much the CDP strategy.
Paradoxically, the main result of Datorama’s specialization is flexibility. The system’s developers set of goal of handling any data source, which led to a system that can ingest nearly any database type, API feed or file format, including JSON and XML; automatically identify the contents of each field; and map the fields to the standard data model. Datorama keeps track of what it learns about common source systems, like Facebook, Adobe Analytics, or AppNexus, making it better at mapping those sources for future implementations. It can also clean, transform, classify, and reformat the inputs to make them more usable, applying advanced features like rules, formulas, and sentiment analysis. At the other end of the process, machine learning builds predictive models to do things like estimate lifetime value and forecast campaign results. The results can be displayed in Datorama’s own interface, read by business intelligence products like Tableau, or exported to other systems like marketing automation.
Datorama’s extensive use of machine learning lets it speed up the marketing analytics process while reducing the cost. But this is still not a push-button solution. The vendor says a typical proof of concept usually takes about one month, and it takes another one to two months more to convert the proof of concept into a production deployment. That’s faster than your father’s data warehouse but not like adding an app to your iPhone. Pricing is also non-trivial: a small company will pay in the five figures for a year’s service and a large company's bill could reach into seven figures. Fees are based on data volume and number of users. Datorama can also provide services to help users get set up or to run the system for them if they prefer.
Tuesday, February 02, 2016
Claritix Assembles Marketing Data for Analysis: Maybe That's Enough
Most of the work in any marketing analytics project is integrating data from multiple systems. Claritix carries this insight to one logical conclusion by offering a system that does data assembly, basic reporting, and little else. No fancy attribution methodologies or custom journey maps here (although they’re on the way). I’m not fully convinced this is enough to justify using Claritix but am open to the possibility. Here’s a deeper look.
As I just said, Claritix’s chief function is assembling customer data from multiple sources. The system has prebuilt connectors to import data from popular vendors including Salesforce.com, Marketo, Hubspot, SAP, SugarCRM, and Facebook. It can connect with others through standard APIs. The imported data is loaded into MongoDB, a NoSQL database that offers great flexibility and ease of deployment. Claritix applies sophisticated algorithms to cleans the data and match contacts based on similarity. It also uses matches created elsewhere such as lead IDs used to synchronize CRM and marketing automation data or cookie IDs imported from Google Analytics. The matching happens at both the contact and account level. Imported data includes contacts, funnel stages, campaigns, channels, revenue, and content.

Users can access this data through dashboards, charts, and views. There are different dashboards for the main data types (campaigns, funnel stages, channels, etc.). These provide basic information such as impressions, engagements, visits, deals and revenue by campaign, or sources, stages, conversion rates, and average duration by funnel stage. The specific measures depend on the data type. Users can drill into details down to the contact level. Views can show results for user-defined segments.
Claritix also lets users assemble information into binders, which are contain pages that are snapshots of dashboards, charts, and notes. These can be exported to PDF or slides or viewed directly within Claritix. Binders can update themselves at regular intervals. Collaboration features let users attach virtual “sticky notes” to screen images and share these via Slack or Claritix’s own communication channels.
So far as I know, that’s pretty much all that the system does. There is no capability, for example, to write the assembled data back to source systems for their own use. Claritix tells me this has been quite sufficient for their initial clients, who have liked the fact that set-up is virtually all automated or handled by the vendor. This has let them assemble data across multiple systems in ways that would otherwise have been impossible or hugely expensive. Certainly price is an advantage: Claritix starts at $1,000 per month for up to 10,000 contacts in the database, with the cost per contact decreasing for higher volumes. A system with more advanced reporting, such as Brightfunnel (which I reviewed in December and has been a consulting client) starts at $3,000 per month or higher. Still, you have to decide whether you’ll need the features that Claritix is missing; if so, you’ll end up missing many of the beneifts that good marketing measurement provides. As Captain Planet used to say, the power is yours.

As I just said, Claritix’s chief function is assembling customer data from multiple sources. The system has prebuilt connectors to import data from popular vendors including Salesforce.com, Marketo, Hubspot, SAP, SugarCRM, and Facebook. It can connect with others through standard APIs. The imported data is loaded into MongoDB, a NoSQL database that offers great flexibility and ease of deployment. Claritix applies sophisticated algorithms to cleans the data and match contacts based on similarity. It also uses matches created elsewhere such as lead IDs used to synchronize CRM and marketing automation data or cookie IDs imported from Google Analytics. The matching happens at both the contact and account level. Imported data includes contacts, funnel stages, campaigns, channels, revenue, and content.

Users can access this data through dashboards, charts, and views. There are different dashboards for the main data types (campaigns, funnel stages, channels, etc.). These provide basic information such as impressions, engagements, visits, deals and revenue by campaign, or sources, stages, conversion rates, and average duration by funnel stage. The specific measures depend on the data type. Users can drill into details down to the contact level. Views can show results for user-defined segments.
Claritix also lets users assemble information into binders, which are contain pages that are snapshots of dashboards, charts, and notes. These can be exported to PDF or slides or viewed directly within Claritix. Binders can update themselves at regular intervals. Collaboration features let users attach virtual “sticky notes” to screen images and share these via Slack or Claritix’s own communication channels.
So far as I know, that’s pretty much all that the system does. There is no capability, for example, to write the assembled data back to source systems for their own use. Claritix tells me this has been quite sufficient for their initial clients, who have liked the fact that set-up is virtually all automated or handled by the vendor. This has let them assemble data across multiple systems in ways that would otherwise have been impossible or hugely expensive. Certainly price is an advantage: Claritix starts at $1,000 per month for up to 10,000 contacts in the database, with the cost per contact decreasing for higher volumes. A system with more advanced reporting, such as Brightfunnel (which I reviewed in December and has been a consulting client) starts at $3,000 per month or higher. Still, you have to decide whether you’ll need the features that Claritix is missing; if so, you’ll end up missing many of the beneifts that good marketing measurement provides. As Captain Planet used to say, the power is yours.

Tuesday, December 22, 2015
Brightfunnel Gives B2B Marketers Self-Service Revenue Attribution
Marketing without revenue attribution is like playing golf without keeping score: it might be fun but you can’t tell whether you’re doing a good job. But while keeping score in golf is simple, figuring out the impact of marketing programs is quite tough. In fact, B2B marketers face several challenges on the road to perfect attribution. The simplest is just connecting marketing leads to closed sales, which is an issue because the data in sales systems is often incomplete. A higher level ties specific marketing programs to individual leads, and through them to accounts and deals. The most advanced efforts estimate the relative impact of different marketing programs on the final result. The problems must be solved in sequence: you must connect leads to revenue before you can connect marketing programs to revenue, and must connect all programs to revenue before you can start to allocate credit among them.
Most marketers struggle to get past the first level. There wouldn’t be a problem if sales people religiously associated every lead with the right account. But this doesn’t always happen for many reasons. So marketers must either accept that they’ll miss some connections, do laborious manual research to make the right matches, or rely on specialized software to do the work.
This is where Brightfunnel comes in. Brightfunnel reads lead, account, and opportunity data from Salesforce.com and supplies missing connections based on things like company name. Since Salesforce.com can also capture lead source (i.e., original marketing program), Brightfunnel can build a complete chain linking marketing programs to leads to accounts to opportunities. The system also has connectors to bring in data from Oracle Eloqua and Marketo, marketing automation, which will often include marketing programs and leads that never made it into Salesforce. But Brightfunnel says that most clients work with Salesforc data alone.
Making connections is certainly important, but Brightfunnel also provides tools to use the resulting information. Marketers can analyze results by marketing program, time period, customer segment, or other variables. They can compare performance over time, compare specific programs against an average, and see top campaigns by lead source. Because the imported opportunity data includes sales stage, reports can also track movement through the sales funnel, calculating conversion rates and velocity (time to move from one stage to the next). The system can use this to forecast the value and timing of future sales from deals currently in the pipeline.
What about that third level of attribution, splitting revenue from a single sale among different marketing programs? Brightfunnel offers two varieties of multitouch attribution: one where credit is shared evenly among all programs that touched a lead, and one where credit is split according to a fixed formula of 40% to the first touch, 20% to middle touches, and 40% to the final touch. Brightfunnel can also show first-touch and last-touch attribution, which attribute all revenue to the first or last touch, respectively.
Attribution aficionados will recognize that none of these is a fully satisfactory approach. The gold standard in attribution is advanced statistical methods that estimate the true incremental impact of each program on each lead. Brightfunnel is working on such a method but hasn’t released it yet. In the meantime, the simpler approaches give some useful insights – so long as you don’t forget they are not wholly accurate.
The value of Brightfunnel is less in advanced analytics than in the fact that it does the basic data assembly and lets marketers analyze data for themselves. Without a tool like Brightfunnel, detailed analysis often requires technical skill and tools that few marketers have available. .
Brightfunnel was introduced in 2014 and has something under 100 clients. Pricing runs from $35,000 to $80,000 per year based on system modules and number of users. The amount of data doesn’t matter. Clients are mostly mid-sized tech companies – the usual early adopters for this sort of thing. The company raised $6 million in Series A funding in October 2015.
 |
| Brightfunnel compares results of different attribution methods |
Most marketers struggle to get past the first level. There wouldn’t be a problem if sales people religiously associated every lead with the right account. But this doesn’t always happen for many reasons. So marketers must either accept that they’ll miss some connections, do laborious manual research to make the right matches, or rely on specialized software to do the work.
This is where Brightfunnel comes in. Brightfunnel reads lead, account, and opportunity data from Salesforce.com and supplies missing connections based on things like company name. Since Salesforce.com can also capture lead source (i.e., original marketing program), Brightfunnel can build a complete chain linking marketing programs to leads to accounts to opportunities. The system also has connectors to bring in data from Oracle Eloqua and Marketo, marketing automation, which will often include marketing programs and leads that never made it into Salesforce. But Brightfunnel says that most clients work with Salesforc data alone.
Making connections is certainly important, but Brightfunnel also provides tools to use the resulting information. Marketers can analyze results by marketing program, time period, customer segment, or other variables. They can compare performance over time, compare specific programs against an average, and see top campaigns by lead source. Because the imported opportunity data includes sales stage, reports can also track movement through the sales funnel, calculating conversion rates and velocity (time to move from one stage to the next). The system can use this to forecast the value and timing of future sales from deals currently in the pipeline.
What about that third level of attribution, splitting revenue from a single sale among different marketing programs? Brightfunnel offers two varieties of multitouch attribution: one where credit is shared evenly among all programs that touched a lead, and one where credit is split according to a fixed formula of 40% to the first touch, 20% to middle touches, and 40% to the final touch. Brightfunnel can also show first-touch and last-touch attribution, which attribute all revenue to the first or last touch, respectively.
Attribution aficionados will recognize that none of these is a fully satisfactory approach. The gold standard in attribution is advanced statistical methods that estimate the true incremental impact of each program on each lead. Brightfunnel is working on such a method but hasn’t released it yet. In the meantime, the simpler approaches give some useful insights – so long as you don’t forget they are not wholly accurate.
The value of Brightfunnel is less in advanced analytics than in the fact that it does the basic data assembly and lets marketers analyze data for themselves. Without a tool like Brightfunnel, detailed analysis often requires technical skill and tools that few marketers have available. .
Brightfunnel was introduced in 2014 and has something under 100 clients. Pricing runs from $35,000 to $80,000 per year based on system modules and number of users. The amount of data doesn’t matter. Clients are mostly mid-sized tech companies – the usual early adopters for this sort of thing. The company raised $6 million in Series A funding in October 2015.
Thursday, October 30, 2014
Wise.io Provides Another Choice for Automated Predictive Modeling

By now, you can probably recite along with me as I list the key differentiators for predictive systems. Let’s run through them with Wise.io as the subject.
• inputs. Wise.io connects to any system with an open API, which includes most major software-as-a-service products. Vendor staff does some basic mapping for each client, which usually takes a couple of hours at most. Most of that time is spent working with the client to decide what data to include in the feed. One important feature of Wise.io is that it can handle very large numbers of inputs – hundreds or thousands of elements – so there’s not much pressure to restrict the inputs too carefully. The system can also take non-API feeds such as batch data loads, although this takes more custom work. It can handle pretty much any type of data and includes advanced natural language processing to extract information from text.
• external data. Many predictive modeling systems, especially for B2B lead scoring, supplement the client’s data with company and individual information they gather themselves from sources like social networks, Web sites, job boards, and government files. Wise.io doesn’t do this.
• data management. Wise.io maintains a database of information it has loaded from source systems. It can accept inputs from multiple sources in different formats. Data is stored on Amazon S3 and Postgres, allowing Wise.io to handle very large volumes. But the system doesn’t link records belonging to the same individual or company unless they have already been coded with a common key.
• automation. Wise.io has almost fully automated the data loading, variable selection, model building, and scoring processes. The system has sophisticated features to automatically adjust for missing values, outliers, inconsistencies, and similar real-world problems that usually require human intervention. To build a new model, users simply select the items to predict and the locations to place the results. The system’s machine learning engine automatically uses existing records in the client’s database to create the model and then places the predictions in the specified fields.
• set-up time. New clients usually have their first model within one day, assuming credentials are available to connect with source systems and the vendor and client can quickly agree on what to import. This is about as quick as it gets. While other vendors work even faster, they do this by limiting themselves to prebuilt connectors to standard systems. There’s nothing wrong with that but bear in mind that even those vendors will take longer once you start to add other inputs.
• outputs. Wise.io generates predictions, confidence scores for the predictions, and lists of drivers that show the reasons for the predictions. These are loaded into client systems where they can generate reports (see below) or be integrated with CRM or customer support agent interfaces.
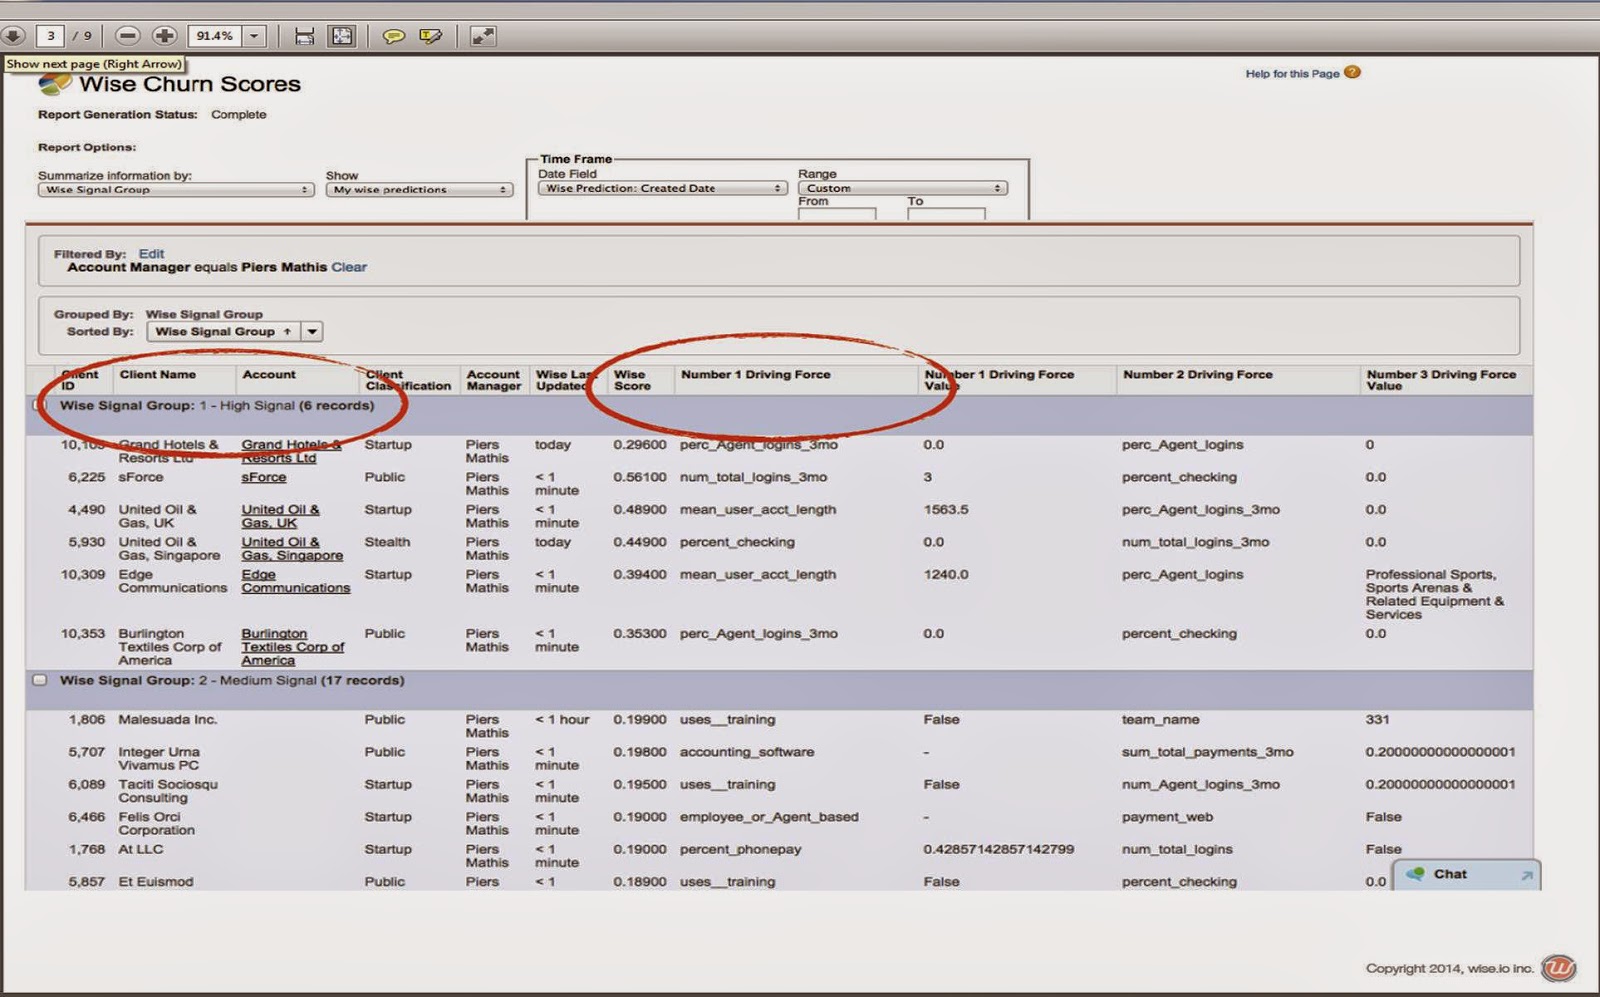
• self-service. After the initial setup, clients can build new models for themselves through a simple interface that basically involves specifying the source data, item to predict, and destination for the results. Adding a new data source would take some help from the vendor but should be pretty quick unless the source lacks a standard API or export tools.
• update frequency. Wise.io will load data in real time as it is updated in client systems, assuming the client system supports this. Scores will reflect the latest data. The system continuously and automatically updates its models to reflect new results.
• applications. Wise.io can be used for pretty much any predictive application, but the company has focused its initial efforts on customer support and retention. This involves tasks such as identifying churn risks and assigning support cases to the proper agent.
• cost. Pricing is based on the number of predictions the system generates, whether those are support tickets, email messages, or customer lists. Enterprise edition installations start in the mid-five figures (i.e., around $50,000) and can go considerably higher. A new self-service edition is limited to specific marketing automation, customer support, and CRM systems and costs somewhat less.
• vendor. The company was launched in 2013 and has some modest venture funding (published figures range from $2.5 million to $3.5 million). It has about a dozen production clients and another two dozen or so in pilot. Client include both consumer and business marketers.
Tuesday, August 05, 2014
VEST Report: Analytics Tops List of Upgraded Marketing Automation Features
 I finished the latest release of the B2B Marketing Automation Vendor Selection Tool (VEST) yesterday, which is always a great relief. But the elation lasted about two minutes, since I then had to write a press release announcing it. The challenge with that is you need a “news hook”, meaning something that gives reporters a reason to write about your story. For the January release, that’s always easy, since I have a new estimate of industry revenues and the press loves that sort of thing. But I can’t repeat that for the mid-year release. That meant I had to dive back into the VEST data and find something interesting to say about it.
Of course, that isn’t all bad, since rolling around in industry data makes me as happy as a pig in mud.* But finding clever insights on demand is still tough. Happily, I did find something intriguing, at least to my obviously-biased eyes. You can read the headline in the press release or – lucky you – get even more details below.
What I did for my analysis was look at changes in vendor scores for the 200 items that go into the VEST data. That gives an interesting view of where vendors are improving their products. I had no particular expectation of what I’d find. But when I looked at the most common items (those which had been upgraded by three or more vendors), it immediately became clear that changes related to analytics were heavily represented. In fact, if you count lead scoring and content testing as part of analytics, seven of the dozen items fell into that category. Who knew?
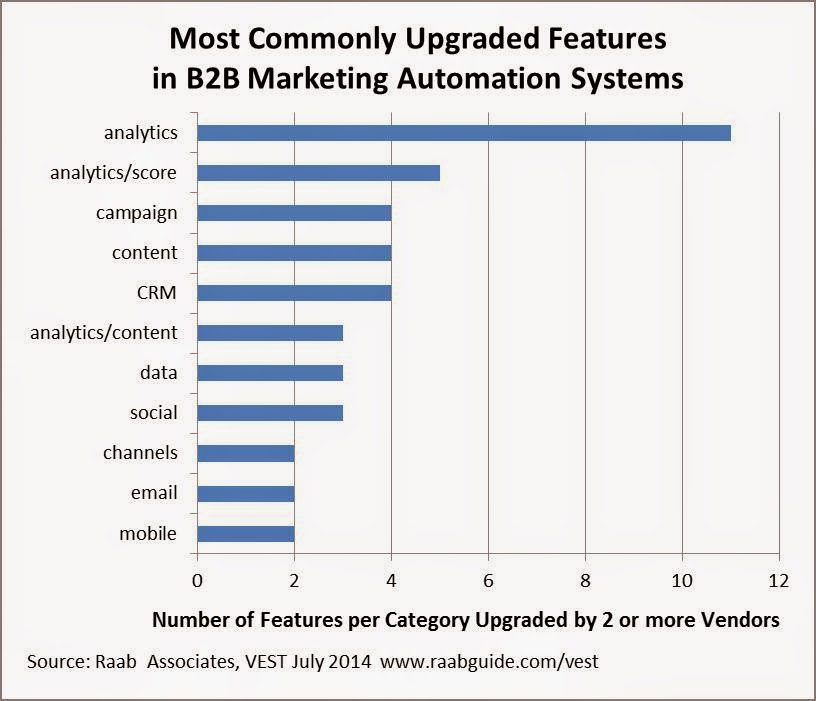
Looking deeper, I expanded my analysis to include items upgraded by two or more vendors, which included 43 of the 200 total. By golly, the results were similar – 19 of the items fell into analytics, compared with just four each in the next most common groups (campaign management, content marketing, and CRM integration). Houston, we have a pattern.
As I say, this result was totally unexpected, but it can still be explained with 20/20 hindsight. I might have expected more development of features for social, mobile, and content marketing, which are top-of-mind for many marketers today. But social and content marketing are mostly managed outside of marketing automation and mobile is mostly limited to ensuring messages are viewable on mobile devices. By contrast, analytics is something most marketers do want from their marketing automation system and an area where great improvements are still possible. So a clear-eyed understanding of how marketing automation is actually used, as opposed to what people are talking about, would have predicted analytics as the focus of vendor attention.

Needless to say, this analysis is really just a byproduct of the primary purpose of the VEST, which is to assemble apples-to-apples comparisons of B2B marketing automation vendors so that buyers have an easier time finding the right system. I’ll probably circle back and write a bit more about the latest data in another post. In the meantime, if you’re actually in the process of making a purchase, or just want to understand the industry better, you can buy your very own copy at the Raab Guide Web site.
_______________________________________________________________________________
* Does anyone know whether pigs really like to roll in mud? It’s a great cliché and all, but I am not a farm boy.
Friday, July 18, 2014
Are Millennial Marketers More Analytical?
I had an interesting conversation this week with a vendor of marketing measurement systems on the question of why more marketers won’t buy his type of software. After all, surveys often show that marketers and CEOs alike rate better measurement as a high priority. Yet actual measurement techniques don’t improve much from year to year: to cite the most recent report to cross my desk, the 2014 State of Marketing Measurement Survey Report from Ifbyphone found that 45% of marketers are measuring Return on Investment in 2014 vs. 40% in 2013 -- a gain that is probably within the survey's margin of error. Other, simpler measures are more common and growing more quickly, but that’s exactly the point: marketers don’t invest in meaningful performance measures like ROI.

My vendor friend’s suspicion was that marketers don’t buy better measurement because, whatever they say in surveys, they really don’t want to be measured. My own opinion, based on comments from marketers over the years, is they don’t have time to put advanced measurement systems in place.
Of course, time is a matter of prioritization, so this really means that marketers think the time spent on an advanced measurement project will produce less value than if that time were spent on something else. In other words, marketers don’t invest in advanced measurement because they don’t think the resulting information will drive enough improvement in their marketing results. That's not an unreasonable belief: much ROI information is in fact interesting but not actionable and, therefore, adds no business value. Further evidence: the advanced measurement techniques that have been widely adopted, like marketing mix models and multi-touch attribution, all have proven bottom-line impact. The impact of marketing ROI, on the other hand, is often less clear.
Then our conversation took an unexpected turn: the vendor speculated that younger marketers might be more analytical and hence more inclined to ROI measurement. This was a new thought to me and offered the cheery prospect of an actual change from the long-term status quo. But neither of us had seen any research on the topic, so we couldn’t judge whether it was likely to be true. End of discussion.
I’ve since had time to look into this more deeply. There’s plenty of research on millennials’ (currently 19-34 years old) in general and a fair amount on their behavior in the workplace. Most of it reinforces familiar stereotypes: millenials are collaborative, tech-savvy, results-focused, fast-working, multi-tasking, anti-hierarchical, socially-conscious, company-disloyal, and of course digitally connected. But none of the research shed much light on whether they’re more or less analytical than older generations: since they’re skeptical of authority, you can expect them to be more open to challenging past assumptions, but this doesn’t necessarily mean they rely on data to resolve those challenges. They could just as easily rely on what feels right to them, even though they’ve had little time to sharpen their intuitions on the stone of reality. Even their presumed affinity for digital media, which is certainly more measurable than traditional media, doesn’t necessarily translate to an interest in ROI measurement. Indeed, most digital measurements such as Web traffic and social media interactions have almost nothing to do with ROI. Finding that millennials rely heavy on them would bode poorly for advanced measurement methods.
But all of this is just speculation, and I am definitely a fact-based kinda guy. Has anyone seen any information on how marketers’ behaviors differ by generation? If not, would you find it an interesting topic for a survey?
My vendor friend’s suspicion was that marketers don’t buy better measurement because, whatever they say in surveys, they really don’t want to be measured. My own opinion, based on comments from marketers over the years, is they don’t have time to put advanced measurement systems in place.
Of course, time is a matter of prioritization, so this really means that marketers think the time spent on an advanced measurement project will produce less value than if that time were spent on something else. In other words, marketers don’t invest in advanced measurement because they don’t think the resulting information will drive enough improvement in their marketing results. That's not an unreasonable belief: much ROI information is in fact interesting but not actionable and, therefore, adds no business value. Further evidence: the advanced measurement techniques that have been widely adopted, like marketing mix models and multi-touch attribution, all have proven bottom-line impact. The impact of marketing ROI, on the other hand, is often less clear.
Then our conversation took an unexpected turn: the vendor speculated that younger marketers might be more analytical and hence more inclined to ROI measurement. This was a new thought to me and offered the cheery prospect of an actual change from the long-term status quo. But neither of us had seen any research on the topic, so we couldn’t judge whether it was likely to be true. End of discussion.
I’ve since had time to look into this more deeply. There’s plenty of research on millennials’ (currently 19-34 years old) in general and a fair amount on their behavior in the workplace. Most of it reinforces familiar stereotypes: millenials are collaborative, tech-savvy, results-focused, fast-working, multi-tasking, anti-hierarchical, socially-conscious, company-disloyal, and of course digitally connected. But none of the research shed much light on whether they’re more or less analytical than older generations: since they’re skeptical of authority, you can expect them to be more open to challenging past assumptions, but this doesn’t necessarily mean they rely on data to resolve those challenges. They could just as easily rely on what feels right to them, even though they’ve had little time to sharpen their intuitions on the stone of reality. Even their presumed affinity for digital media, which is certainly more measurable than traditional media, doesn’t necessarily translate to an interest in ROI measurement. Indeed, most digital measurements such as Web traffic and social media interactions have almost nothing to do with ROI. Finding that millennials rely heavy on them would bode poorly for advanced measurement methods.
But all of this is just speculation, and I am definitely a fact-based kinda guy. Has anyone seen any information on how marketers’ behaviors differ by generation? If not, would you find it an interesting topic for a survey?
Friday, April 04, 2014
Bottlenose Offers Real-Time Trend Intelligence For Social Media and Beyond
I had an interesting briefing a few weeks ago from Bottlenose, which sells what it calls a real-time “trend intelligence” system. The general idea is almost boringly straightforward: monitor events as they occur and pick out new and interesting information. But the technology to make this happen is mind-bogglingly complex, since it includes real-time ingestion of diverse data types, several levels of natural language processing, and sophisticated trend detection.

To give some idea of the scale involved, the company said that simply monitoring “Beyoncé” across social and broadcast media creates 220 billion (with a “b”) data points relating to 2 billion times series tracking more than 100 metrics on 2.5 million entities. The company currently stores trillions (with a "t") of observations for its current dozen or so clients, all big enterprises and agencies including Pepsico, General Motors, Microsoft, Digitas and Razorfish.
Bottlenose keeps up with the world pretty much the same way that you and I do: it scans news, social media, and other sources for information, extracts what’s relevant to our needs, and identifies new information or trends that might require some action. But while we humans can only process a tiny amount of information at each stage, Bottlenose works on another level entirely.
• Data sources. The system ingests huge swaths of social media, virtually every TV and radio broadcast in the U.S., U.K., and Canada (via automated speech-to-text conversion), Nielsen ratings and audience demographics, and stock market data. It can also accept other market and industry data, as well as a company’s own Web analytics, customer purchases and service interactions. This is all processed in real time, using technologies that handle thousands of messages per second per processor. The system can accept any data format from structured transactions to unstructured text.
• Interpretation. Specialized natural language processing extracts entities such as people and topics, identifies concepts and links, and assesses sentiment. This happens without predefined taxonomies or linguistics, although the system does work with nearly 100 rule-based, expansible classes of messages. It appends metadata to entities by matching them with other data sets, such as audience demographics for a TV broadcast. The system maintains profiles on 350 million individuals world-wide, including demographics, cumulative sentiment, language, geography, and social media influence.

• Trend identification. Bottlenose builds a time line tracking more than 150 metrics per entity, such as cumulative sentiment, audience size, influence scores, and demographics. Software agents constantly scan this data for trends, which could include connections, correlations, overlaps, clusters, or other relationships. When the system finds emerging trends that appear to be more than statistical noise, it highlights them in reports.
• Actions. Automated alerts for new trends are high on the Bottlenose agenda, but hadn’t been released when we spoke in March. What users get is a variety of interfaces that let them select a given topic, see relationships and what’s trending, and dig into as much detail as they want – all using real-time data. Key capabilities include seeing connections among topics, seeing the volume of messages and trends in sentiment, analyzing audiences demographics, and comparing statistics for two entities such as competing brands or media channels. Practical applications include identifying the most important influencers on a given topic, finding the most effective hash tags for social media, assessing advertising impact, and buying more effective media.
The underlying technology for all this involves a variety of tools, some proprietary. The company calls its core processing stack "StreamSense" and says it uses several open source technologies including the Cassandra distributed database and Elasticsearch real time search and analytics engine. Although StreamSense is a platform that could be used for many purposes, the company so far has only offered it in conjunction with the Bottlenose trend intelligence application.
Of course, this platform potential is one reason I find Bottlenose so intriguing. (The other is, it's just plain cool to work with so many kinds of data in such volume so quickly.) Bottlenose is certainly not offering a Customer Data Platform, since its system is an application, not a central database available to external applications. I'm not even sure that StreamSense meets the operational requirements for a CDP database, which have less to do with real-time analytics than easy access and flexibility. But I do know that CDPs deal with higher data volumes and more varied structures than conventional databases can support, so I'm keeping an eye out for alternative technologies that might be better solutions. Bottlenose might just have one.
Bottlenose was founded in 2010 and launched its original social media dashboard in 2011. It has expanded beyond the social listening category with its enterprise product, which adds TV and radio to social activity. Pricing starts at $200,000 to $500,000 per year, although some deals are larger.
To give some idea of the scale involved, the company said that simply monitoring “Beyoncé” across social and broadcast media creates 220 billion (with a “b”) data points relating to 2 billion times series tracking more than 100 metrics on 2.5 million entities. The company currently stores trillions (with a "t") of observations for its current dozen or so clients, all big enterprises and agencies including Pepsico, General Motors, Microsoft, Digitas and Razorfish.
Bottlenose keeps up with the world pretty much the same way that you and I do: it scans news, social media, and other sources for information, extracts what’s relevant to our needs, and identifies new information or trends that might require some action. But while we humans can only process a tiny amount of information at each stage, Bottlenose works on another level entirely.
• Data sources. The system ingests huge swaths of social media, virtually every TV and radio broadcast in the U.S., U.K., and Canada (via automated speech-to-text conversion), Nielsen ratings and audience demographics, and stock market data. It can also accept other market and industry data, as well as a company’s own Web analytics, customer purchases and service interactions. This is all processed in real time, using technologies that handle thousands of messages per second per processor. The system can accept any data format from structured transactions to unstructured text.
• Interpretation. Specialized natural language processing extracts entities such as people and topics, identifies concepts and links, and assesses sentiment. This happens without predefined taxonomies or linguistics, although the system does work with nearly 100 rule-based, expansible classes of messages. It appends metadata to entities by matching them with other data sets, such as audience demographics for a TV broadcast. The system maintains profiles on 350 million individuals world-wide, including demographics, cumulative sentiment, language, geography, and social media influence.
• Trend identification. Bottlenose builds a time line tracking more than 150 metrics per entity, such as cumulative sentiment, audience size, influence scores, and demographics. Software agents constantly scan this data for trends, which could include connections, correlations, overlaps, clusters, or other relationships. When the system finds emerging trends that appear to be more than statistical noise, it highlights them in reports.
• Actions. Automated alerts for new trends are high on the Bottlenose agenda, but hadn’t been released when we spoke in March. What users get is a variety of interfaces that let them select a given topic, see relationships and what’s trending, and dig into as much detail as they want – all using real-time data. Key capabilities include seeing connections among topics, seeing the volume of messages and trends in sentiment, analyzing audiences demographics, and comparing statistics for two entities such as competing brands or media channels. Practical applications include identifying the most important influencers on a given topic, finding the most effective hash tags for social media, assessing advertising impact, and buying more effective media.
The underlying technology for all this involves a variety of tools, some proprietary. The company calls its core processing stack "StreamSense" and says it uses several open source technologies including the Cassandra distributed database and Elasticsearch real time search and analytics engine. Although StreamSense is a platform that could be used for many purposes, the company so far has only offered it in conjunction with the Bottlenose trend intelligence application.
Of course, this platform potential is one reason I find Bottlenose so intriguing. (The other is, it's just plain cool to work with so many kinds of data in such volume so quickly.) Bottlenose is certainly not offering a Customer Data Platform, since its system is an application, not a central database available to external applications. I'm not even sure that StreamSense meets the operational requirements for a CDP database, which have less to do with real-time analytics than easy access and flexibility. But I do know that CDPs deal with higher data volumes and more varied structures than conventional databases can support, so I'm keeping an eye out for alternative technologies that might be better solutions. Bottlenose might just have one.
Bottlenose was founded in 2010 and launched its original social media dashboard in 2011. It has expanded beyond the social listening category with its enterprise product, which adds TV and radio to social activity. Pricing starts at $200,000 to $500,000 per year, although some deals are larger.
Friday, January 18, 2013
IBM Interact Adds Interactions to Enterprise Marketing Management
My continuing tour of real time interaction managers landed with the good folks at IBM two weeks ago, where I caught up with what’s now IBM Interact. The product was originally launched more than a decade ago by Unica as Affinium Interact.*
The concept of Interact has stayed quite consistent over the years, although the underlying technology has been overhauled several times. The general trend of the changes has been closer integration with other components of the IBM/Unica marketing suite. For example, the original Interact had its own flow chart interface, but the system now uses the same segmentation interface as IBM Campaign. The two modules can also share segment definitions, offers, and interaction history. There’s also some integration with other IBM marketing products, notably the Product Recommendation component inherited from IBM’s CoreMetrics acquisition.
Interact's concept is the same as other interaction managers: touchpoints send it data about a current interaction; the system uses rules, models and data to select one or more offers; and the offers are sent back to the touchpoint for delivery. The differences among these systems are matters of nuance: Interact stores its own permanent customer profiles, while some other systems must re-load data from external systems during each interaction. Interact assigns fixed scores to offers within each segment definitions, while other systems use scoring formulas shared across segments (although Interact can do that too). Interact can create self-training predictive models, not all competitors have this option.
A couple of other features seem more or less unique. Interact determines whether customers are eligible for an offer using either qualification rules or Campaign-generated “white lists” and “black lists”; other systems use rules alone. Interact can also assign offers at global, segment, or individual levels, while other systems don’t provide all those choices.
It’s unlikely that any of these differences make Interact significantly more powerful or easier to use than competitors. In practice, the system’s major appeal will be its close integration with Campaign and other IBM products. It is now part of the IBM’s Enterprise Marketing Management (EMM) group, which includes both Unica and Coremetrics, both acquired in 2010. This group supports IBM’s larger strategy of selling systems that use huge quantities of data to run all aspects of large organizations. The company has identified marketing organizations as a major potential market within this strategy and is spending aggressively to both develop that market and take advantage of it.
You might think that Interact plays a central role in IBM’s marketing ecosystem: after all, real-time interactions are the epitome of data-driven marketing. But just a tiny fraction of IBM’s 2,500 EMM customers use Interact (actual figures are confidential) and most deployments seem to be focused on specific -- dare I say tactical? -- applications in one or two channels. The company’s EMM focus seems to be more on analytics and outbound marketing: for example, its most recent EMM acquisitions were Tealeaf Technology (Web experience analysis) and DemandTec (merchandising analysis) . But it does report increasing interest in Interact among its clients, and high hopes for future growth.
_________________________________________________________________________
*A year’s free AARP membership to everyone who remembers the Affinium brand and can sing the jingle.**
** Okay, just kidding. There never was an Affinium jingle, so far as I know.
The concept of Interact has stayed quite consistent over the years, although the underlying technology has been overhauled several times. The general trend of the changes has been closer integration with other components of the IBM/Unica marketing suite. For example, the original Interact had its own flow chart interface, but the system now uses the same segmentation interface as IBM Campaign. The two modules can also share segment definitions, offers, and interaction history. There’s also some integration with other IBM marketing products, notably the Product Recommendation component inherited from IBM’s CoreMetrics acquisition.
Interact's concept is the same as other interaction managers: touchpoints send it data about a current interaction; the system uses rules, models and data to select one or more offers; and the offers are sent back to the touchpoint for delivery. The differences among these systems are matters of nuance: Interact stores its own permanent customer profiles, while some other systems must re-load data from external systems during each interaction. Interact assigns fixed scores to offers within each segment definitions, while other systems use scoring formulas shared across segments (although Interact can do that too). Interact can create self-training predictive models, not all competitors have this option.
A couple of other features seem more or less unique. Interact determines whether customers are eligible for an offer using either qualification rules or Campaign-generated “white lists” and “black lists”; other systems use rules alone. Interact can also assign offers at global, segment, or individual levels, while other systems don’t provide all those choices.
It’s unlikely that any of these differences make Interact significantly more powerful or easier to use than competitors. In practice, the system’s major appeal will be its close integration with Campaign and other IBM products. It is now part of the IBM’s Enterprise Marketing Management (EMM) group, which includes both Unica and Coremetrics, both acquired in 2010. This group supports IBM’s larger strategy of selling systems that use huge quantities of data to run all aspects of large organizations. The company has identified marketing organizations as a major potential market within this strategy and is spending aggressively to both develop that market and take advantage of it.
You might think that Interact plays a central role in IBM’s marketing ecosystem: after all, real-time interactions are the epitome of data-driven marketing. But just a tiny fraction of IBM’s 2,500 EMM customers use Interact (actual figures are confidential) and most deployments seem to be focused on specific -- dare I say tactical? -- applications in one or two channels. The company’s EMM focus seems to be more on analytics and outbound marketing: for example, its most recent EMM acquisitions were Tealeaf Technology (Web experience analysis) and DemandTec (merchandising analysis) . But it does report increasing interest in Interact among its clients, and high hopes for future growth.
_________________________________________________________________________
*A year’s free AARP membership to everyone who remembers the Affinium brand and can sing the jingle.**
** Okay, just kidding. There never was an Affinium jingle, so far as I know.
Monday, October 22, 2012
Marketing Lessons from Chernobyl

I’ll be speaking about optimization this Wednesday at the Online Marketing Summit conference in Santa Clara, CA. Since I’m very comfortable with the actual topic, most of my prep time has been spent looking for pictures for my slides.
One discovery was the image above, which shows is how I think most people imagine optimization: a team of dead-serious revenue engineers carefully tweaking dials and watching gauges until they find the perfect balance among alternative marketing investments. That the real world isn’t quite so rigorous is a sad truth I’ll cover during the conference.
But this picture isn’t just any power plant. It’s the control room at the Chernobyl nuclear reactor which disastrously exploded in 1986. Look closely, and what do you notice?
Yes, those hats. Apparently the Chernobyl plant was being run by pastry chefs. That explains so much.
My theory is this: the Soviets had a little-known tradition that translates roughly as “switch jobs with your friends day”. The year of the accident, a team of bakers decided to change places with their buddies in the Chernobyl control room. The nuclear engineers spent the day calculating the volume of pie tins and optimizing heat convection in the baking ovens. Meanwhile, the pastry chefs were decorating fuel rods with icing and asking, “What if we replace the reactor coolant with meringue?”
This did not end well.
Well, maybe that didn’t happen. But my imaginary pastry chefs sound a lot like stereotypical marketers: experts in a subjective field where decisions are based on taste, feel, and appearance, and progress comes through intuitive experimentation. Those methods work well in the kitchen, but can’t be safely transferred to a nuclear reactor. Nor do they work for marketing optimization.
Like reactor management, marketing optimization programs need to be based on deep knowledge of the underlying process. They rely on precise tracking mechanisms that support long-term monitoring of detailed results. They need to be run by marketing equivalent of nuclear engineers, not pastry chefs.
This doesn’t mean that data geeks should take over marketing. Chances are, things weren’t going very well in the Chernobyl bakery that day, either. The city needed both bakers and scientists. But having them wasn’t enough: they needed each in the right place. Marketing departments are the same.
Saturday, November 13, 2010
Rapid Insight Provides Low-Cost Options for Desktop Data Transformation and Predictive Modeling
Summary: Rapid Insight offers low-cost desktop tools for data transformation and automated regression modeling. They're a good choice for companies that need something simple yet powerful.
Predictive modeling is widely used by consumer marketers to select names for mailing lists and to decide which products to offer existing customers. These models are typically built by statisticians with tools like SAS and SPSS. In other cases, marketers can build them for themselves with automated tools like KXEN that are tightly integrated with the marketing automation system.
But most marketers still don’t have a marketing automation system or even an integrated marketing database. Nor do they have the skills to use a product like SAS. This group needs stand-alone tools to do two key things: assemble data from multiple sources, and build and execute the models themselves. (Okay, three things.)
Rapid Insight offers exactly those two (or three) capabilities in a reasonably priced package.
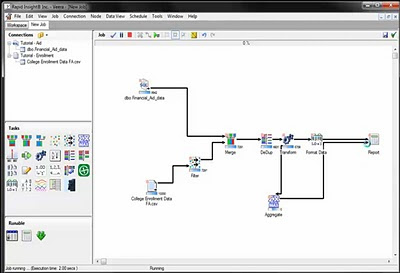
Veera is the data assembly tool. It lets users connect to most standard data sources and then define a processing flow to filter, merge, aggregate, transform and otherwise manhandle data into a form that makes it useful. Veera also provides some basic analytics including descriptive statistics (mean, median, value frequencies, etc.), cross tabs and graphing. The flow is set up as a sequence of icons with a drag-and-drop interface, which means users don’t have to learn a scripting language. Rather than go into more details, I'll just point you to the vendor's on-demand demo.
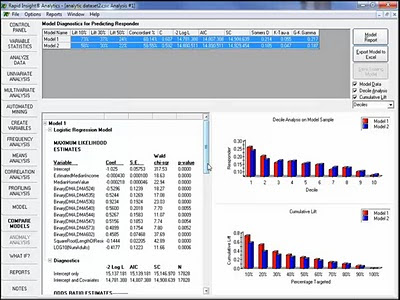
The predictive modeling tool, prosaically named Analytics, builds logistic and least squares regression models. (Logistic models predict yes/no outcomes such as whether someone will respond to a promotion; least squares models predict continuous numeric outcomes such as lifetime value.) The Analytics interface is more sequential than Veera: users get a set of tabs that lead them through the steps of loading data, selecting variables, building the model itself, assessing the results, and scoring an audience. At each step along the way, users can make their own decisions or allow the system to choose for them.
I’ve seen quite a few automated modeling systems over the years, and was impressed at how well Analytics provides users with information to understand what's happening and take control when desired. This should let the system satisfy knowledgeable statisticians looking for a productivity enhancer, as well as novices who want to rely on the system's choices. Analytics also has a good online demo.
Veera and Analytics both run in client/server or desktop configurations. They load data into system memory (RAM), which means very large projects could be problematic. The vendor says a half-million rows with a couple hundred variables is a reasonable universe to model.
The two products are sold separately. This makes sense: many companies could use a generic data assembly tool like Veera for purposes other than modeling. For example, marketers might use it to construct a multi-source marketing database for promotions or analytics.
Pricing is $3,000 for the first Veera user and $5,000 for Analytics, with discounts for additional licenses. This is quite reasonable compared with other automated modeling systems, although other products often provide more than just regression models. Annual maintenance for each product is $1,750 per license. Rapid Insights has been selling its products since 2005 and has more than 150 clients with over 200 licenses.
Predictive modeling is widely used by consumer marketers to select names for mailing lists and to decide which products to offer existing customers. These models are typically built by statisticians with tools like SAS and SPSS. In other cases, marketers can build them for themselves with automated tools like KXEN that are tightly integrated with the marketing automation system.
But most marketers still don’t have a marketing automation system or even an integrated marketing database. Nor do they have the skills to use a product like SAS. This group needs stand-alone tools to do two key things: assemble data from multiple sources, and build and execute the models themselves. (Okay, three things.)
Rapid Insight offers exactly those two (or three) capabilities in a reasonably priced package.
Veera is the data assembly tool. It lets users connect to most standard data sources and then define a processing flow to filter, merge, aggregate, transform and otherwise manhandle data into a form that makes it useful. Veera also provides some basic analytics including descriptive statistics (mean, median, value frequencies, etc.), cross tabs and graphing. The flow is set up as a sequence of icons with a drag-and-drop interface, which means users don’t have to learn a scripting language. Rather than go into more details, I'll just point you to the vendor's on-demand demo.

The predictive modeling tool, prosaically named Analytics, builds logistic and least squares regression models. (Logistic models predict yes/no outcomes such as whether someone will respond to a promotion; least squares models predict continuous numeric outcomes such as lifetime value.) The Analytics interface is more sequential than Veera: users get a set of tabs that lead them through the steps of loading data, selecting variables, building the model itself, assessing the results, and scoring an audience. At each step along the way, users can make their own decisions or allow the system to choose for them.
I’ve seen quite a few automated modeling systems over the years, and was impressed at how well Analytics provides users with information to understand what's happening and take control when desired. This should let the system satisfy knowledgeable statisticians looking for a productivity enhancer, as well as novices who want to rely on the system's choices. Analytics also has a good online demo.

Veera and Analytics both run in client/server or desktop configurations. They load data into system memory (RAM), which means very large projects could be problematic. The vendor says a half-million rows with a couple hundred variables is a reasonable universe to model.
The two products are sold separately. This makes sense: many companies could use a generic data assembly tool like Veera for purposes other than modeling. For example, marketers might use it to construct a multi-source marketing database for promotions or analytics.
Pricing is $3,000 for the first Veera user and $5,000 for Analytics, with discounts for additional licenses. This is quite reasonable compared with other automated modeling systems, although other products often provide more than just regression models. Annual maintenance for each product is $1,750 per license. Rapid Insights has been selling its products since 2005 and has more than 150 clients with over 200 licenses.
Thursday, August 26, 2010
DataMentors Offers Low-Cost Marketing Database
Summary: DataMentors has launched a low-cost marketing database product with limited functionality. It's an interesting test of what marketers really want.
Marketing database software and service vendor DataMentors last week tossed its hat into the ever-more-crowded ring of marketing automation for small(ish) businesses. The new product, DataPoint, is a limited version of the company’s flagship PinPoint system. Like PinPoint, it combines DataMentor’s DataFuse data cleansing and matching software with a private-label version of SmartFocus campaign management and analysis. The difference is that PinPoint scales to tens of millions of customer records, while DataPoint is limited to 100,000 customers, one million prospects, fifty data fields and quarterly file updates. Pricing is $2,000 per month, probably less than half what most marketing automation vendors charge for a 100,000 name installation.
Wait. Back up. Did I just write quarterly updates? Fifty fields? Warm up the eight track and fluff out my mullet, modern marketing automation products don’t have those types of limits. Nor does DataMentor’s own PinPoint. What's going on here?
Even though DataPoint includes the quite sophisticated campaign management features of SmartFocus, it’s really less a marketing system than a tool for data analysis. Marketers without any access to their customer data will be happy to load their files into DataPoint and do all the cool slicing and dicing that the SmartFocus engine makes easy. They might produce some outbound campaigns as well, but lack of fresh data means these are going to be pretty generic.
It’s tempting to relate this old-school approach to the origins of DataMentors itself: it was co-founded by industry veteran Bob Orf , the “O” is OKRA Marketing, a pioneer marketing database vendor founded in 1987 when small records and infrequent updates were the rule. But DataMentors has kept up with the times: Orf says that most PinPoint systems are updated daily or weekly, and the company even offers real-time, Web service access to its data quality system. And of course DataPoint users can upgrade to a more powerful version if they’re willing to pay.
That being the case, it’s probably more useful to think of DataPoint as part of the market for on-demand business intelligence – competing in some ways with companies like Birst, PivotLink and Oco. Although those systems are more flexible than DataPoint, they share its low deployment cost and focus on analytics rather than marketing execution.
One key advantage DataPoint has over those systems is integration with DataFuse, a highly sophisticated matching engine that was DataMentor’s original product and remains the cornerstone of its business. Another difference is that DataMentors has recently licensed consumer and business databases for its clients to use as prospect lists or to enhance their own files. DataFuse users can access these for an extra $1,000 per month – another highly competitive rate. DataPoint clients will also benefit from the deep expertise of DataMentors staff, particularly in the banking industry.
A configuration like DataPoint is not something I would have expected in today’s market, where continuous updates, flexible data models and near-real-time customer interactions are standard operating procedure. But I have tremendous respect for the DataMentors team and trust them to know their market. It will certainly be interesting to see how well DataPoint works out for them.
Marketing database software and service vendor DataMentors last week tossed its hat into the ever-more-crowded ring of marketing automation for small(ish) businesses. The new product, DataPoint, is a limited version of the company’s flagship PinPoint system. Like PinPoint, it combines DataMentor’s DataFuse data cleansing and matching software with a private-label version of SmartFocus campaign management and analysis. The difference is that PinPoint scales to tens of millions of customer records, while DataPoint is limited to 100,000 customers, one million prospects, fifty data fields and quarterly file updates. Pricing is $2,000 per month, probably less than half what most marketing automation vendors charge for a 100,000 name installation.
Wait. Back up. Did I just write quarterly updates? Fifty fields? Warm up the eight track and fluff out my mullet, modern marketing automation products don’t have those types of limits. Nor does DataMentor’s own PinPoint. What's going on here?
Even though DataPoint includes the quite sophisticated campaign management features of SmartFocus, it’s really less a marketing system than a tool for data analysis. Marketers without any access to their customer data will be happy to load their files into DataPoint and do all the cool slicing and dicing that the SmartFocus engine makes easy. They might produce some outbound campaigns as well, but lack of fresh data means these are going to be pretty generic.
It’s tempting to relate this old-school approach to the origins of DataMentors itself: it was co-founded by industry veteran Bob Orf , the “O” is OKRA Marketing, a pioneer marketing database vendor founded in 1987 when small records and infrequent updates were the rule. But DataMentors has kept up with the times: Orf says that most PinPoint systems are updated daily or weekly, and the company even offers real-time, Web service access to its data quality system. And of course DataPoint users can upgrade to a more powerful version if they’re willing to pay.
That being the case, it’s probably more useful to think of DataPoint as part of the market for on-demand business intelligence – competing in some ways with companies like Birst, PivotLink and Oco. Although those systems are more flexible than DataPoint, they share its low deployment cost and focus on analytics rather than marketing execution.
One key advantage DataPoint has over those systems is integration with DataFuse, a highly sophisticated matching engine that was DataMentor’s original product and remains the cornerstone of its business. Another difference is that DataMentors has recently licensed consumer and business databases for its clients to use as prospect lists or to enhance their own files. DataFuse users can access these for an extra $1,000 per month – another highly competitive rate. DataPoint clients will also benefit from the deep expertise of DataMentors staff, particularly in the banking industry.
A configuration like DataPoint is not something I would have expected in today’s market, where continuous updates, flexible data models and near-real-time customer interactions are standard operating procedure. But I have tremendous respect for the DataMentors team and trust them to know their market. It will certainly be interesting to see how well DataPoint works out for them.
Monday, April 05, 2010
VisualIQ Measures Marketing Impacts Across All Channels
Summary: VisualIQ combines customer-level transactions and contact history with traditional aggregate data to produce better marketing performance measurement. It hasn't solved the problem of identifying the same customer across channels, but it's trying.
I was going to start this post by writing that last-click attribution has recently come under fire, but the first Google hit on the topic brings up a study from 2007. So maybe the criticism isn’t particularly new. But the fact remains that, now more than ever, marketers are trying to measure the impact of all contacts on customer behavior.
Broadly speaking, the problem is attacked in two ways. One, most common among consumer goods manufacturers and others who do not sell directly to their customers, uses aggregated data in marketing mix models to find correlations between marketing efforts and total sales. The other, favored by banks, retailers, communications providers and others who do sell directly to known buyers, assesses the impact of each contact with specific individuals. Last-click attribution is a particular challenge for online marketers because they fall between these two situations: they can often identify their buyers but not trace their full contact history.
VisualIQ, founded in 2005 as Connexion.a, proposes to straddle these worlds by combining aggregate-level models with customer-specific contact history. They haven’t found a magic bullet: like everyone else, VisualIQ tracks online customers through cookies, with all the limits that implies. But VisualIQ strives to make the best use of what’s available by unifying data from as many online campaigns as possible, linking cookies with online transactions, and then linking online transactions to offline identities.
This approach offers some general advantages and two specific capabilities. The general advantages come from assembling all advertising and customer transaction information in one database. This allows VisualIQ to analyze campaign results, do whatever identity matching is possible, and to isolate the impact of source, contact frequency, demographics, location and other variables. VisualIQ, a hosted service, has invested heavily in technology to analyze massive data sets along such dimensions.
The first specific capability is relating pre-purchase contacts to actual purchases for individual customers, thus moving beyond last-click attribution. Although this is subject to the limits of cookie-based tracking, VisualIQ does what it can to build a unified identity by sharing the same cookie IDs across as many online channels as possible. The second capability is building mix models with data from actual customer contacts instead of market-level estimates or surveys. VisualIQ says it has found this yields more accurate results than traditional information.
This is all good stuff and VisualIQ has packaged it nicely in a tiered set of offerings. These range from campaign-level reporting to customer-based insights to predictive modeling and simulation, with prices for the simplest system starting as low as $5,000 to $10,000 per month. The company has had considerable success, counting major banks, retailers, and communications firms as clients. Note that these are all industries that sell to their customers directly.
But VisualIQ’s specific offerings are just part of the story. What’s really important is setting explicit goals of linking identities across channels and measuring cross-channel marketing impacts. These are arguably the core challenges in marketing measurement today. This focus has led VisualIQ to look for alternatives to cookies and to use existing methods to combine online and offline information for the same person.
The company is also seeking to make it easier to apply its results. Today, it basically generates reports that suggest better media allocations and advertising contents. But it is working to automatically feed those findings as rules into execution systems such as ad servers and ad exchanges. This brings marketers closer to the ultimate goal of self-optimizing programs. Other vendors are also pursuing self-optimization, but VisualIQ promises the advantage of decisions based on data from all channels rather than a single channel or, heaven forbid, just the last click.
I was going to start this post by writing that last-click attribution has recently come under fire, but the first Google hit on the topic brings up a study from 2007. So maybe the criticism isn’t particularly new. But the fact remains that, now more than ever, marketers are trying to measure the impact of all contacts on customer behavior.
Broadly speaking, the problem is attacked in two ways. One, most common among consumer goods manufacturers and others who do not sell directly to their customers, uses aggregated data in marketing mix models to find correlations between marketing efforts and total sales. The other, favored by banks, retailers, communications providers and others who do sell directly to known buyers, assesses the impact of each contact with specific individuals. Last-click attribution is a particular challenge for online marketers because they fall between these two situations: they can often identify their buyers but not trace their full contact history.
VisualIQ, founded in 2005 as Connexion.a, proposes to straddle these worlds by combining aggregate-level models with customer-specific contact history. They haven’t found a magic bullet: like everyone else, VisualIQ tracks online customers through cookies, with all the limits that implies. But VisualIQ strives to make the best use of what’s available by unifying data from as many online campaigns as possible, linking cookies with online transactions, and then linking online transactions to offline identities.
This approach offers some general advantages and two specific capabilities. The general advantages come from assembling all advertising and customer transaction information in one database. This allows VisualIQ to analyze campaign results, do whatever identity matching is possible, and to isolate the impact of source, contact frequency, demographics, location and other variables. VisualIQ, a hosted service, has invested heavily in technology to analyze massive data sets along such dimensions.
The first specific capability is relating pre-purchase contacts to actual purchases for individual customers, thus moving beyond last-click attribution. Although this is subject to the limits of cookie-based tracking, VisualIQ does what it can to build a unified identity by sharing the same cookie IDs across as many online channels as possible. The second capability is building mix models with data from actual customer contacts instead of market-level estimates or surveys. VisualIQ says it has found this yields more accurate results than traditional information.
This is all good stuff and VisualIQ has packaged it nicely in a tiered set of offerings. These range from campaign-level reporting to customer-based insights to predictive modeling and simulation, with prices for the simplest system starting as low as $5,000 to $10,000 per month. The company has had considerable success, counting major banks, retailers, and communications firms as clients. Note that these are all industries that sell to their customers directly.
But VisualIQ’s specific offerings are just part of the story. What’s really important is setting explicit goals of linking identities across channels and measuring cross-channel marketing impacts. These are arguably the core challenges in marketing measurement today. This focus has led VisualIQ to look for alternatives to cookies and to use existing methods to combine online and offline information for the same person.
The company is also seeking to make it easier to apply its results. Today, it basically generates reports that suggest better media allocations and advertising contents. But it is working to automatically feed those findings as rules into execution systems such as ad servers and ad exchanges. This brings marketers closer to the ultimate goal of self-optimizing programs. Other vendors are also pursuing self-optimization, but VisualIQ promises the advantage of decisions based on data from all channels rather than a single channel or, heaven forbid, just the last click.
Subscribe to:
Posts (Atom)