Over the past few months, I’ve had conversations with “demand generation” software vendors including Eloqua, Vtrenz and Manticore, and been on the receiving end of a drip marketing stream from yet another (Moonray Marketing, lately renamed OfficeAutoPilot).
What struck me was that each vendor stressed its ability to give a detailed view of prospects’ activities on the company Web site (pages visited, downloads requested, time spent, etc.) The (true) claim is that this information gives a significant insight into the prospect’s state of mind: the exact issues that concern them, their current degree of interest, and which people at the prospect company were involved. Of course, the Web information is combined with conventional contact history such as emails sent and call notes to give a complete view of the customer’s situation..
Even though I’ve long known it was technically possible for companies can track my visits in such detail, I’ll admit I still find it a bit spooky. It just doesn’t seem quite sporting of them to record what I’m doing if I haven’t voluntarily identified myself by registration or logging in. But I suppose it’s not a real privacy violation. I also know that if this really bothered me, I could remove cookies on a regular basis and foil much of the tracking.
Lest I comfort myself that my personal behavior is more private, another conversation with the marketing software people at SAS reminded me that they use the excellent Web behavior tracking technology of UK-based Speed-Trap to similarly monitor consumer activities. (I originally wrote about the SAS offering, called Customer Experience Analytics, when it was launched in the UK in February 2007. It is now being offered elsewhere.) Like the demand generation systems, SAS and Speed-Trap can record anonymous visits and later connect them to personal profiles once the user is identified.
Detailed tracking of individual behavior is quite different from traditional Web analytics, which are concerned with mass statistics—which pages are viewed most often, what paths do most customers follow, which offers yield the highest response. Although the underlying technology is similar, the focus on individuals supports highly personalized marketing.
In fact, the ability of these systems to track individual behavior is what links their activity monitoring features to what I have previously considered the central feature of the demand generation systems: the ability to manage automated, multi-step contact streams. This is still a major selling point and vendors continue to make such streams more powerful and easier to use. But it no longer seems to be the focus of their presentations.
Perhaps contact streams are no longer a point of differentiation simply because so many products now have them in a reasonably mature form. But I suspect the shift reflects something more fundamental. I believe that marketers now recognize, perhaps only intuitively, that the amount of detailed, near-immediate information now available about individual customers substantially changes their business. Specifically, it makes possible more effective treatments than a small number of conventional contact streams can provide.
Conventional contact streams are relatively difficult to design, deploy and maintain. As a result, they are typically limited to a small number of key decisions. The greater volume of information now available implies a much larger number of possible decisions, so a new approach is needed.
This will still use decision rules to react as events occur. But the rules will make more subtle distinctions among events, based on the details of the events themselves and the context provided by surrounding events. This may eventually involve advanced analytics to uncover subtle relationships among events and behaviors, and to calculate the optimal response in each situation. However, those analytics are not yet in place. Until they are, human decision-makers will do a better job of integrating the relevant information and finding the best response. This is why the transformation has started with demand generation systems, which are used primarily in business-to-business situations where sales people personally manage individual customer relationships.
Over time, the focus of these systems will shift from simply capturing information and presenting it to humans, to reacting to that information automatically. The transition may be nearly imperceptible since it will employ technologies that already exist, such as recommendation engines and interaction management systems. These will gradually take over an increasing portion of the treatment decisions as they gradually improve the quality of the decisions they can make. Only when we compare today’s systems with those in place several years from now will we see how radically the situation has changed.
But the path is already clear. As increasing amounts of useful information become accessible, marketers will find tools to take advantage of it. Today, the volume is overwhelming, like oil gushing into the air from a newly drilled well. Eventually marketers will cap that well and use its stream of information invisibly but even more effectively—not wasting a single precious drop.
Thursday, May 15, 2008


Thursday, May 08, 2008
Infobright Puts a Clever Twist on the Columnar Database
It took me some time to form a clear picture of analytical database vendor Infobright, despite an excellent white paper that seems to have since vanished from their Web site. [Note: Per Susan Davis' comment below, they have since reloaded it here.] Infobright’s product, named BrightHouse, confused me because it is a SQL-compatible, columnar database, which makes it sound similar to systems like Vertica and ParAccel (click here for my ParAccel entry).
But it turns out there is a critical difference: while those other products rely on massively parallel (MPP) hardware for scalability and performance, BrightHouse runs on conventional (SMP) servers. The system gains its performance edge by breaking each database column into 65K chunks called “data packs”, and reading relatively few packs to resolve most queries.
The trick is that BrightHouse stores descriptive information about each data pack and can often use this information to avoid loading the pack itself. For example, the descriptive information holds minimum and maximum values of data within the pack, plus summary data such as totals. This means that a query involving a certain value range may determine that all or none of the records within a pack are qualified. If all values are out of range, the pack can be ignored; if all values are in range, the summary data may suffice. Only when some but not all of the records within a pack are relevant must the pack itself be loaded from disk and decompressed. According to CEO Miriam Tuerk, this approach can reduce data transfers by up to 90%. The data is also highly compressed when loaded into the packs—by ratios as high as 50:1, although 10:1 is average. This reduces hardware costs and yields even faster disk reads. By contrast, data in MPP columnar systems often takes up as much or more storage space as the source files.
This design is substantially more efficient than conventional columnar systems, which read every record in a given column to resolve queries involving that column. The small size of the BrightHouse data packs means that many packs will be totally included or excluded from queries even without their contents being sorted when the data is loaded. This lack of sorting, along with the lack of indexing or data hashing, yields load rates of up to 250 GB per hour. This is impressive for a SMP system, although MPP systems are faster.
You may wonder what happens to BrightHouse when queries require joins across tables. It turns out that even in these cases, the system can use its summary data to exclude many data packs. In addition, the system watches queries as they execute and builds a record of which data packs are related to other data packs. Subsequent queries can use this information to avoid opening data packs unnecessarily. The system thus gains a performance advantage without requiring a single, predefined join path between tables—something that is present in some other columnar systems, though not all of them. The net result of all this is great flexibility: users can load data from existing source systems without restructuring it, and still get excellent analytical performance.
BrightHouse uses the open source MySQL database interface, allowing it to connect with any data source that is accessible to MySQL. According to Tuerk, it is the only version of MySQL that scales beyond 500 GB. Its scalability is still limited, however, to 30 to 50 TB of source data, which would be a handful of terabytes once compressed. The system runs on any Red Hat Linux 5 server—for example, a 1 TB installation runs on a $22,000 Dell. A Windows version is planned for later this year. The software itself costs $30,000 per terabyte of source data (one-time license plus annual maintenance), which puts it towards the low end of other analytical systems.
Infobright was founded in 2005 although development of the BrightHouse engine began earlier. Several production systems were in place by 2007. The system was officially launched in early 2008 and now has about dozen production customers.
But it turns out there is a critical difference: while those other products rely on massively parallel (MPP) hardware for scalability and performance, BrightHouse runs on conventional (SMP) servers. The system gains its performance edge by breaking each database column into 65K chunks called “data packs”, and reading relatively few packs to resolve most queries.
The trick is that BrightHouse stores descriptive information about each data pack and can often use this information to avoid loading the pack itself. For example, the descriptive information holds minimum and maximum values of data within the pack, plus summary data such as totals. This means that a query involving a certain value range may determine that all or none of the records within a pack are qualified. If all values are out of range, the pack can be ignored; if all values are in range, the summary data may suffice. Only when some but not all of the records within a pack are relevant must the pack itself be loaded from disk and decompressed. According to CEO Miriam Tuerk, this approach can reduce data transfers by up to 90%. The data is also highly compressed when loaded into the packs—by ratios as high as 50:1, although 10:1 is average. This reduces hardware costs and yields even faster disk reads. By contrast, data in MPP columnar systems often takes up as much or more storage space as the source files.
This design is substantially more efficient than conventional columnar systems, which read every record in a given column to resolve queries involving that column. The small size of the BrightHouse data packs means that many packs will be totally included or excluded from queries even without their contents being sorted when the data is loaded. This lack of sorting, along with the lack of indexing or data hashing, yields load rates of up to 250 GB per hour. This is impressive for a SMP system, although MPP systems are faster.
You may wonder what happens to BrightHouse when queries require joins across tables. It turns out that even in these cases, the system can use its summary data to exclude many data packs. In addition, the system watches queries as they execute and builds a record of which data packs are related to other data packs. Subsequent queries can use this information to avoid opening data packs unnecessarily. The system thus gains a performance advantage without requiring a single, predefined join path between tables—something that is present in some other columnar systems, though not all of them. The net result of all this is great flexibility: users can load data from existing source systems without restructuring it, and still get excellent analytical performance.
BrightHouse uses the open source MySQL database interface, allowing it to connect with any data source that is accessible to MySQL. According to Tuerk, it is the only version of MySQL that scales beyond 500 GB. Its scalability is still limited, however, to 30 to 50 TB of source data, which would be a handful of terabytes once compressed. The system runs on any Red Hat Linux 5 server—for example, a 1 TB installation runs on a $22,000 Dell. A Windows version is planned for later this year. The software itself costs $30,000 per terabyte of source data (one-time license plus annual maintenance), which puts it towards the low end of other analytical systems.
Infobright was founded in 2005 although development of the BrightHouse engine began earlier. Several production systems were in place by 2007. The system was officially launched in early 2008 and now has about dozen production customers.
Friday, May 02, 2008
Trust Me: Buyers Worry Too Much About Software Costs
I ranted a bit the other week about buyers who focus too much on software license fees and not enough on differences in productivity. The key to that argument is that software costs are a relatively small portion of companies’ total investment in a business intelligence system. This is self-evident to me, based on personal experience, and seems fairly widely accepted by others in the field. But it’s always nice to have hard numbers to cite as proof.
In search of that, I poked around a bit and found several references to a 2007 study from AMR Research . The study itself, Market Demand for Business Intelligence and Performance Management (BI/PM), 2007 will cost you $4,000. But statistics from it were quoted elsewhere, and showed the following distribution of estimated spending for 2007:
31.4%...internal labor costs
24.7%...software costs
16.2%...integration costs
15.4%...hardware costs
12.3%...outsourced services
The most relevant tidbit is that software accounts for just one quarter of total costs, while labor and outside services combined account for over 40%. I’m not sure what counts as “integration” but suspect that is mostly labor as well, which would raise the total to nearly 60%. This confirms my feeling that people should focus on more than software costs.
A February 2008 study from Aberdeen Group, Managing the TCO of Business Intelligence (payment required), addresses the question of whether buyers do in fact focus primarily on software costs.
The short answer is yes. The long answer is it’s often hard to interpret Aberdeen findings. But when they asked buyers which direct cost criteria were ranked as critical at the time of purchase, the highest rating was indeed software license cost. Looking just at what Aberdeen calls “best-in-class” companies, the figures were:
42%...software license cost
37%...implementation consulting costs
15%...user training services offered
10%...additional hardware costs
Aberdeen also reported priority rankings for indirect costs and ongoing costs. Software fees don’t play much of a role in those areas, but, even so, people still didn’t focus on labor. Instead, the top priorities were “ease of use for end users” for indirect costs and “scalability of data volumes and users” for ongoing costs. Ease of development and ongoing support costs did finally show up as the second and third ranked items under ongoing costs, but that’s digging pretty deep.
Of course, you can’t really combine these two sets of figures. But if you could, you might argue that they show a clear skew in buyer priorities: 42% give highest priority to software costs even though these account for just 25% of expenses. Even though the numbers don’t really prove it, I’d say that’s very close to the truth.
In search of that, I poked around a bit and found several references to a 2007 study from AMR Research . The study itself, Market Demand for Business Intelligence and Performance Management (BI/PM), 2007 will cost you $4,000. But statistics from it were quoted elsewhere, and showed the following distribution of estimated spending for 2007:
31.4%...internal labor costs
24.7%...software costs
16.2%...integration costs
15.4%...hardware costs
12.3%...outsourced services
The most relevant tidbit is that software accounts for just one quarter of total costs, while labor and outside services combined account for over 40%. I’m not sure what counts as “integration” but suspect that is mostly labor as well, which would raise the total to nearly 60%. This confirms my feeling that people should focus on more than software costs.
A February 2008 study from Aberdeen Group, Managing the TCO of Business Intelligence (payment required), addresses the question of whether buyers do in fact focus primarily on software costs.
The short answer is yes. The long answer is it’s often hard to interpret Aberdeen findings. But when they asked buyers which direct cost criteria were ranked as critical at the time of purchase, the highest rating was indeed software license cost. Looking just at what Aberdeen calls “best-in-class” companies, the figures were:
42%...software license cost
37%...implementation consulting costs
15%...user training services offered
10%...additional hardware costs
Aberdeen also reported priority rankings for indirect costs and ongoing costs. Software fees don’t play much of a role in those areas, but, even so, people still didn’t focus on labor. Instead, the top priorities were “ease of use for end users” for indirect costs and “scalability of data volumes and users” for ongoing costs. Ease of development and ongoing support costs did finally show up as the second and third ranked items under ongoing costs, but that’s digging pretty deep.
Of course, you can’t really combine these two sets of figures. But if you could, you might argue that they show a clear skew in buyer priorities: 42% give highest priority to software costs even though these account for just 25% of expenses. Even though the numbers don’t really prove it, I’d say that’s very close to the truth.
Monday, April 28, 2008
New Web Site and Archive
The new Web site I mentioned the other day is now up and running at http://www.raabassociatesinc.com/. This turned out to be an interesting little science project. I had originally figured to go the usual route of hiring a Web developer, but realized while I was assessing tools for this blog and MPM Toolkit that I could easily build the site myself in Wordpress in a fraction of the time and nearly for free. Even more important, I can make changes at will. I also looked at the open source content management system Joomla, which would have given some additional capabilities. But Joomla had a steeper learning curve and didn't seem worth the bother, at least for now.
Part of the project was a new archive of my past articles, which is now technically its own Wordpress blog. The big advantage vs. our old archive is you now get a proper search function. Anybody interested in a trip down memory lane regarding marketing software is welcome to browse articles dating from 1993. I've always figured someone would write a doctoral thesis based on this stuff.
Part of the project was a new archive of my past articles, which is now technically its own Wordpress blog. The big advantage vs. our old archive is you now get a proper search function. Anybody interested in a trip down memory lane regarding marketing software is welcome to browse articles dating from 1993. I've always figured someone would write a doctoral thesis based on this stuff.
Thursday, April 24, 2008
WiseGuys Gives Small Firms Powerful List Selection Software
Like a doctor specialized in “diseases of the rich”, I've been writing mostly about technologies for large organizations: specialized databases, enterprise marketing systems, advanced business intelligence platforms. But the majority of businesses have nowhere near the resources needed to manage such systems. They still need sophisticated applications, but in versions that can be installed and operated with a minimum of technical assistance.
WiseGuys from Desktop Marketing Solutions, Inc. (DMSI) is a good example of the breed. It is basically a system to help direct marketers select names for catalog mailings and email. But while simple query engines rely on the marketer to know whom to pick, WiseGuys provides substantial help with that decision. More to the point—and this the hallmark of a good small business product—it provides the refinements needed to make a system usable in the real world. In big enterprise products, these adjustments would be handled by technical staff through customization or configurations. In WiseGuys, marketers can control them directly.
Let’s start at the beginning. WiseGuys imports customer and transaction records from an external fulfillment system. During the import process, it does calculations including RFM (recency, frequency, monetary value) scoring, Lifetime Value, response attribution, promotion profitability, and cross-purchases ratios between product pairs. What’s important is that the system recognizes it can’t simply do those calculations on every record it gets. There will always be some customers, some products, some transactions, some campaigns or some date ranges that should be excluded for one reason or another. In fact, there will be different sets of exclusions for different purposes. WiseGuys handles this gracefully by letting users define multiple “setups” which define collections of records and the tasks that will apply to them. Thus, instead of one RFM score there might be several, each suited to a particular type of promotion or customer segment. These setups can be run once or refreshed automatically with each update.
The data import takes incremental changes in the source information – that is, new and updated customers and new transactions – rather than requiring a full reload. It identifies duplicate records, choosing the survivor based on recency, RFM score or presence of an email address as the user prefers. The system will combine the transaction history of the duplicates, but not move information from one customer record to another. This means that if the surviving record lacks information such as the email address or telephone number, it will not be copied from a duplicate record that does.
The matching process itself takes the simplistic approach of comparing the first few characters of the Zip Code, last name and street address. Although most modern systems are more sophisticated, DMSI says its method has proven adequate. One help is that the system can be integrated with AccuZip postal processing software to standardize addresses, which is critical to accurate character-based matching.
The matching process can also create an organization key to link individuals within a household or business. Selections can be limited to one person per organization. RFM scores can also be created for an organization by combining the transactions of its members.
As you’d expect, WiseGuys gives the user many options for how RFM is calculated. The basic calculation remains constant: the RFM score is the sum of scores for each of the three components. But the component scores can be based on user-specified ranges or on fixed divisions such as quintiles or quartiles. Users decide on the ranges separately for each component. They also specify the number of points assigned to each range. DMSI can calculate these values through a regression analysis based on reports extracted from the system.
Actual list selections can use RFM scores by themselves or in combination with other elements. Users can take all records above a specified score or take the highest-scoring records available to meet a specified quantity. Each selection can be assigned a catalog (campaign) code and source code and, optionally, a version code based on random splits for testing. The system can also flag customers in a control group that was selected for a promotion but withheld from the mailing. The same catalog code can be assigned to multiple selections for unified reporting. Unlike most marketing systems, WiseGuys does not maintain a separate campaign table with shared information such as costs and content details.
Once selections are complete, users can review the list of customers and their individual information, such as last response date and number of promotions in the past year. Users can remove individual records from the list before it is extracted. The list can be generated in formats for mail and email delivery. The system automatically creates a promotion history record for each selected customer.
Response attribution also occurs during the file update. The system first matches any source codes captured with the orders against the list of promotion source codes. If no source code is available, it applies the orders based on promotions received by the customer, using either the earliest (typically for direct mail) or latest (for email) promotion in a user-specified time window.
The response reports show detailed statistics by catalog, source and version codes, including mail date, mail quantity, responses, revenue, cost of goods, and derived measures such as profit per mail piece. Users can click on a row in the report and see the records of the individual responders as imported from the source systems. The system can also create response reports by RFM segment, which are extracted to calculate the RFM range scores. Other reports show Lifetime Value grouped by entry year, original source, customer status, business segment, time between first and most recent order, RFM scores, and other categories. The Lifetime Value figures only show cumulative past results (over a user-specified time frame): the system does not do LTV projections.
Cross sell reports show the percentage of customers who bought specific pairs of products. The system can use this to produce a customer list showing the three products each customer is most likely to purchase. DMSI says this has been used for email campaigns, particularly to sell consumables, with response rates as high as 7% to 30%. The system will generate a personalized URL that sends each customer to a custom Web site.
WiseGuys was introduced in 2003 and expanded steadily over the years. It runs on a Windows PC and uses the Microsoft Access database engine. A version based on SQL Server was added recently. The one-time license for the Access versions ranges from $1,990 to $3,990 depending on mail volume and fulfillment system (users of Dydacomp http://www.dydacomp.com Mail Order Manager get a discount). The SQL Server version costs $7,990. The system has about 50 clients.
WiseGuys from Desktop Marketing Solutions, Inc. (DMSI) is a good example of the breed. It is basically a system to help direct marketers select names for catalog mailings and email. But while simple query engines rely on the marketer to know whom to pick, WiseGuys provides substantial help with that decision. More to the point—and this the hallmark of a good small business product—it provides the refinements needed to make a system usable in the real world. In big enterprise products, these adjustments would be handled by technical staff through customization or configurations. In WiseGuys, marketers can control them directly.
Let’s start at the beginning. WiseGuys imports customer and transaction records from an external fulfillment system. During the import process, it does calculations including RFM (recency, frequency, monetary value) scoring, Lifetime Value, response attribution, promotion profitability, and cross-purchases ratios between product pairs. What’s important is that the system recognizes it can’t simply do those calculations on every record it gets. There will always be some customers, some products, some transactions, some campaigns or some date ranges that should be excluded for one reason or another. In fact, there will be different sets of exclusions for different purposes. WiseGuys handles this gracefully by letting users define multiple “setups” which define collections of records and the tasks that will apply to them. Thus, instead of one RFM score there might be several, each suited to a particular type of promotion or customer segment. These setups can be run once or refreshed automatically with each update.
The data import takes incremental changes in the source information – that is, new and updated customers and new transactions – rather than requiring a full reload. It identifies duplicate records, choosing the survivor based on recency, RFM score or presence of an email address as the user prefers. The system will combine the transaction history of the duplicates, but not move information from one customer record to another. This means that if the surviving record lacks information such as the email address or telephone number, it will not be copied from a duplicate record that does.
The matching process itself takes the simplistic approach of comparing the first few characters of the Zip Code, last name and street address. Although most modern systems are more sophisticated, DMSI says its method has proven adequate. One help is that the system can be integrated with AccuZip postal processing software to standardize addresses, which is critical to accurate character-based matching.
The matching process can also create an organization key to link individuals within a household or business. Selections can be limited to one person per organization. RFM scores can also be created for an organization by combining the transactions of its members.
As you’d expect, WiseGuys gives the user many options for how RFM is calculated. The basic calculation remains constant: the RFM score is the sum of scores for each of the three components. But the component scores can be based on user-specified ranges or on fixed divisions such as quintiles or quartiles. Users decide on the ranges separately for each component. They also specify the number of points assigned to each range. DMSI can calculate these values through a regression analysis based on reports extracted from the system.
Actual list selections can use RFM scores by themselves or in combination with other elements. Users can take all records above a specified score or take the highest-scoring records available to meet a specified quantity. Each selection can be assigned a catalog (campaign) code and source code and, optionally, a version code based on random splits for testing. The system can also flag customers in a control group that was selected for a promotion but withheld from the mailing. The same catalog code can be assigned to multiple selections for unified reporting. Unlike most marketing systems, WiseGuys does not maintain a separate campaign table with shared information such as costs and content details.
Once selections are complete, users can review the list of customers and their individual information, such as last response date and number of promotions in the past year. Users can remove individual records from the list before it is extracted. The list can be generated in formats for mail and email delivery. The system automatically creates a promotion history record for each selected customer.
Response attribution also occurs during the file update. The system first matches any source codes captured with the orders against the list of promotion source codes. If no source code is available, it applies the orders based on promotions received by the customer, using either the earliest (typically for direct mail) or latest (for email) promotion in a user-specified time window.
The response reports show detailed statistics by catalog, source and version codes, including mail date, mail quantity, responses, revenue, cost of goods, and derived measures such as profit per mail piece. Users can click on a row in the report and see the records of the individual responders as imported from the source systems. The system can also create response reports by RFM segment, which are extracted to calculate the RFM range scores. Other reports show Lifetime Value grouped by entry year, original source, customer status, business segment, time between first and most recent order, RFM scores, and other categories. The Lifetime Value figures only show cumulative past results (over a user-specified time frame): the system does not do LTV projections.
Cross sell reports show the percentage of customers who bought specific pairs of products. The system can use this to produce a customer list showing the three products each customer is most likely to purchase. DMSI says this has been used for email campaigns, particularly to sell consumables, with response rates as high as 7% to 30%. The system will generate a personalized URL that sends each customer to a custom Web site.
WiseGuys was introduced in 2003 and expanded steadily over the years. It runs on a Windows PC and uses the Microsoft Access database engine. A version based on SQL Server was added recently. The one-time license for the Access versions ranges from $1,990 to $3,990 depending on mail volume and fulfillment system (users of Dydacomp http://www.dydacomp.com Mail Order Manager get a discount). The SQL Server version costs $7,990. The system has about 50 clients.
Wednesday, April 16, 2008
OpenBI Finds Success with Open Source BI Software
I had an interesting conversation last week with Steve Miller and Rich Romanik of OpenBI a consultancy specializing in using open source products for business intelligence. It was particularly relevant because I’ve also been watching an IT Toolbox discussion of BI platform selection degenerate into a debate about whose software is cheaper. The connection, of course, is that nothing’s cheaper than open source, which is usually free (or, as the joke goes, very reasonable*) .
Indeed, if software cost were the only issue, then open source should already have taken over the world. One reason it hasn’t is that early versions of open source projects are often not as powerful or easy to use as commercial software. But this evolves over time, with each project obviously on its own schedule. Open source databases like MySQL, Ingres and PostgreSQL are now at or near parity with the major commercial products, except for some specialized applications. According to Miller, open source business intelligence tools including Pentaho and JasperSoft are now highly competitive as well. In fact, he said that they are actually more integrated than commercial products, which use separate systems for data extraction, transformation and loading (ETL), reporting, dashboards, rules, and so on. The open source BI tools offer these as services within a single platform.
My own assumption has been that the primary resistance to open source is based on the costs of retraining. Staff who are already familiar with existing solutions are reluctant to devalue their experience by bringing in something new, and managers are reluctant to pay the costs in training and lost productivity. Miller said that half the IT people he sees today are consultants, not employees, whom a company would simply replace with other consultants if it switched tools. It’s a good point, but I’m guessing the remaining employees are the ones making most of the selection decisions. Retraining them, not to mention end-users, is still an issue.
In other words, there still must be a compelling reason for a company will switch from commercial to open source products—or, indeed, from an incumbent to any other vendor. Since the majority of project costs come from labor, not software, the most likely advantage would be increased productivity. But Miller said productivity with open source BI tools is about the same as with commercial products: not any worse, now that the products have matured sufficiently, but also not significantly better. He said he has seen major productivity improvements recently, but these have come through “agile” development methods that change how people work, not the tools they use. (I don’t recall whether he used the term "agile".)
I did point out that certain products—QlikView being exhibit A—can offer meaningful productivity improvements over existing standard technologies. But I’m not sure he believed me.
Of course, agile methods can be applied with any tool, so the benefits from open source still come down to savings on software licenses. These can be substantial for a large company: a couple hundred dollars per seat becomes real money when thousands of users are involved. Still, even those costs can easily be outweighed by small changes in productivity: add a database administrator here and an extra cube designer there, and in no time you’ve spent more than you saved on software.
This circles right back to the quality issue. Miller argued that open source products improve faster than commercial systems, so eventually any productivity gaps will be eliminated or even reversed in open source’s favor. Since open source allows day-to-day users to work directly on the problems that are bothering them, it may in fact do better at making incremental productivity improvements than a top-down corporate development process. I'm less sure this applies to major as well as incremental innovations, but suppose examples of radical open source innovation could be found.
Whatever. At the moment, it seems the case for open source BI is strong but not overwhelming. In other words, a certain leap of faith is still required. Miller said most of OpenBI’s business has come from companies where other types of open source systems have already been adopted successfully. These firms have gotten over their initial resistance and found that the quality is acceptable. The price is certainly right.
*******************************************************************************
* (Guy to girl: “Are you free on Saturday night?” Girl to guy: “No, but I’m reasonable”. Extra points to whoever lists the most ways that is politically incorrect.)
Indeed, if software cost were the only issue, then open source should already have taken over the world. One reason it hasn’t is that early versions of open source projects are often not as powerful or easy to use as commercial software. But this evolves over time, with each project obviously on its own schedule. Open source databases like MySQL, Ingres and PostgreSQL are now at or near parity with the major commercial products, except for some specialized applications. According to Miller, open source business intelligence tools including Pentaho and JasperSoft are now highly competitive as well. In fact, he said that they are actually more integrated than commercial products, which use separate systems for data extraction, transformation and loading (ETL), reporting, dashboards, rules, and so on. The open source BI tools offer these as services within a single platform.
My own assumption has been that the primary resistance to open source is based on the costs of retraining. Staff who are already familiar with existing solutions are reluctant to devalue their experience by bringing in something new, and managers are reluctant to pay the costs in training and lost productivity. Miller said that half the IT people he sees today are consultants, not employees, whom a company would simply replace with other consultants if it switched tools. It’s a good point, but I’m guessing the remaining employees are the ones making most of the selection decisions. Retraining them, not to mention end-users, is still an issue.
In other words, there still must be a compelling reason for a company will switch from commercial to open source products—or, indeed, from an incumbent to any other vendor. Since the majority of project costs come from labor, not software, the most likely advantage would be increased productivity. But Miller said productivity with open source BI tools is about the same as with commercial products: not any worse, now that the products have matured sufficiently, but also not significantly better. He said he has seen major productivity improvements recently, but these have come through “agile” development methods that change how people work, not the tools they use. (I don’t recall whether he used the term "agile".)
I did point out that certain products—QlikView being exhibit A—can offer meaningful productivity improvements over existing standard technologies. But I’m not sure he believed me.
Of course, agile methods can be applied with any tool, so the benefits from open source still come down to savings on software licenses. These can be substantial for a large company: a couple hundred dollars per seat becomes real money when thousands of users are involved. Still, even those costs can easily be outweighed by small changes in productivity: add a database administrator here and an extra cube designer there, and in no time you’ve spent more than you saved on software.
This circles right back to the quality issue. Miller argued that open source products improve faster than commercial systems, so eventually any productivity gaps will be eliminated or even reversed in open source’s favor. Since open source allows day-to-day users to work directly on the problems that are bothering them, it may in fact do better at making incremental productivity improvements than a top-down corporate development process. I'm less sure this applies to major as well as incremental innovations, but suppose examples of radical open source innovation could be found.
Whatever. At the moment, it seems the case for open source BI is strong but not overwhelming. In other words, a certain leap of faith is still required. Miller said most of OpenBI’s business has come from companies where other types of open source systems have already been adopted successfully. These firms have gotten over their initial resistance and found that the quality is acceptable. The price is certainly right.
*******************************************************************************
* (Guy to girl: “Are you free on Saturday night?” Girl to guy: “No, but I’m reasonable”. Extra points to whoever lists the most ways that is politically incorrect.)
Tuesday, April 15, 2008
Making Some Changes
Maybe it's that spring has finally arrived, but, for whatever reason, I have several changes to announce.
- I've also started a new blog "MPM Toolkit" at http://mpmtoolkit.blogspot.com/. In this case, MPM stands for Marketing Performance Measurement. This has a been a topic of growing professional interest to me; in fact, I have a book due out on the topic this fall (knock wood). I felt the subject was different enough from what I've been writing about here to justify a blog of its own. Trying to keep the brand messages clear, as it were.
- I have resumed working under the Raab Associates Inc. umbrella, and am now a consultant rather than partner with Client X Client. This has more to do with accounting than anything else. It does, however, force me to revisit my portion of the Raab Associates Web site, which has not been updated since the (Bill) Clinton Administration. I'll probably set up a new separate site fairly soon.
Sorry to bore you with personal details. I'll make a more substantive post tomorrow.
- Most obviously, I've changed the look of this blog itself. Partly it's because I was tired of the old look, but mostly it's to allow me to take advantage of new capabilities now provided by Blogger. The most interesting is a new polling feature. You'll see the first poll at the right.
- I've also started a new blog "MPM Toolkit" at http://mpmtoolkit.blogspot.com/. In this case, MPM stands for Marketing Performance Measurement. This has a been a topic of growing professional interest to me; in fact, I have a book due out on the topic this fall (knock wood). I felt the subject was different enough from what I've been writing about here to justify a blog of its own. Trying to keep the brand messages clear, as it were.
- I have resumed working under the Raab Associates Inc. umbrella, and am now a consultant rather than partner with Client X Client. This has more to do with accounting than anything else. It does, however, force me to revisit my portion of the Raab Associates Web site, which has not been updated since the (Bill) Clinton Administration. I'll probably set up a new separate site fairly soon.
Sorry to bore you with personal details. I'll make a more substantive post tomorrow.
Wednesday, April 09, 2008
Bah, Humbug: Let's Not Forget the True Meaning of On-Demand
I was skeptical the other day about the significance of on-demand business intelligence. I still am. But I’ve also been thinking about the related notion of on-demand predictive modeling. True on-demand modeling – which to me means the client sends a pile of data and gets back a scored customer or prospect list – faces the same obstacle as on-demand BI: the need for careful data preparation. Any modeler will tell you that fully automated systems make errors that would be obvious to a knowledgeable human. Call it the Sorcerer’s Apprentice effect.
Indeed, if you Google “on demand predictive model”, you will find just a handful of vendors, including CopperKey, Genalytics and Angoss. None of these provides the generic “data in, scores out” service I have in mind. There are, however, some intriguing similarities among them. Both CopperKey and Genalytics match the input data against national consumer and business databases. Both Angoss and CopperKey offer scoring plug-ins to Salesforce.com. Both Genalytics and Angoss will also build custom models using human experts.
I’ll infer from this that the state of the art simply does not support unsupervised development of generic predictive models. Either you need human supervision, or you need standardized inputs (e.g., Salesforce.com data), or you must supplement the data with known variables (e.g. third-party databases).
Still, I wonder if there is an opportunity. I was playing around recently with a very simple, very robust scoring method a statistician showed me more than twenty years ago. (Sum of Z-scores on binary variables, if you care.) This did a reasonably good job of predicting product ownership in my test data. More to the point, the combined modeling-and-scoring process needed just a couple dozen lines of code in QlikView. It might have been a bit harder in other systems, given how powerful QlikView is. But it’s really quite simple regardless.
The only requirements are that the input contains a single record for each customer and that all variables are coded as 1 or 0. Within those constraints, any kind of inputs are usable and any kind of outcome can be predicted. The output is a score that ranks the records by their likelihood of meeting the target condition.
Now, I’m fully aware that better models can be produced with more data preparation and human experts. But there must be many situations where an approximate ranking would be useful if it could be produced in minutes with no prior investment for a couple hundred dollars. That's exactly what this approach makes possible: since the process is fully automated, the incremental cost is basically zero. Pricing would only need to cover overhead, marketing and customer support.
The closest analogy I can think of among existing products are on-demand customer data integration sites. These also take customer lists submitted over the Internet and automatically return enhanced versions – in their case, IDs that link duplicates, postal coding, and sometimes third-party demograhpics and other information. Come to think of it, similar services perform on-line credit checks. Those have proven to be viable businesses, so the fundamental idea is not crazy.
Whether on-demand generic scoring is also viable, I can’t really say. It’s not a business I am likely to pursue. But I think it illustrates that on-demand systems can provide value by letting customers do things with no prior setup. Many software-as-a-service vendors stress other advantages: lower cost of ownership, lack of capital investment, easy remote access, openness to external integration, and so on. These are all important in particular situations. But I’d also like to see vendors explore the niches where “no prior setup and no setup cost” offers the greatest value of all.
Indeed, if you Google “on demand predictive model”, you will find just a handful of vendors, including CopperKey, Genalytics and Angoss. None of these provides the generic “data in, scores out” service I have in mind. There are, however, some intriguing similarities among them. Both CopperKey and Genalytics match the input data against national consumer and business databases. Both Angoss and CopperKey offer scoring plug-ins to Salesforce.com. Both Genalytics and Angoss will also build custom models using human experts.
I’ll infer from this that the state of the art simply does not support unsupervised development of generic predictive models. Either you need human supervision, or you need standardized inputs (e.g., Salesforce.com data), or you must supplement the data with known variables (e.g. third-party databases).
Still, I wonder if there is an opportunity. I was playing around recently with a very simple, very robust scoring method a statistician showed me more than twenty years ago. (Sum of Z-scores on binary variables, if you care.) This did a reasonably good job of predicting product ownership in my test data. More to the point, the combined modeling-and-scoring process needed just a couple dozen lines of code in QlikView. It might have been a bit harder in other systems, given how powerful QlikView is. But it’s really quite simple regardless.
The only requirements are that the input contains a single record for each customer and that all variables are coded as 1 or 0. Within those constraints, any kind of inputs are usable and any kind of outcome can be predicted. The output is a score that ranks the records by their likelihood of meeting the target condition.
Now, I’m fully aware that better models can be produced with more data preparation and human experts. But there must be many situations where an approximate ranking would be useful if it could be produced in minutes with no prior investment for a couple hundred dollars. That's exactly what this approach makes possible: since the process is fully automated, the incremental cost is basically zero. Pricing would only need to cover overhead, marketing and customer support.
The closest analogy I can think of among existing products are on-demand customer data integration sites. These also take customer lists submitted over the Internet and automatically return enhanced versions – in their case, IDs that link duplicates, postal coding, and sometimes third-party demograhpics and other information. Come to think of it, similar services perform on-line credit checks. Those have proven to be viable businesses, so the fundamental idea is not crazy.
Whether on-demand generic scoring is also viable, I can’t really say. It’s not a business I am likely to pursue. But I think it illustrates that on-demand systems can provide value by letting customers do things with no prior setup. Many software-as-a-service vendors stress other advantages: lower cost of ownership, lack of capital investment, easy remote access, openness to external integration, and so on. These are all important in particular situations. But I’d also like to see vendors explore the niches where “no prior setup and no setup cost” offers the greatest value of all.
Wednesday, April 02, 2008
illuminate Systems' iLuminate May Be the Most Flexible Analytical Database Ever
OK, I freely admit I’m fascinated by offbeat database engines. Maybe there is a support group for this. In any event, the highlight of my brief visit to the DAMA International Symposium and Wilshire Meta-Data Conference conference last month was a presentation by Joe Foley of illuminate Solutions , which marked the U.S. launch of his company’s iLuminate analytical database.
(Yes, the company name is “illuminate” and the product is “iLuminate”. And if you look inside the HTML tag, you’ll see the Internet domain is “i-lluminate.com”. Marketing genius or marketing madness? You decide.)
illuminate calls iLuminate a “correlation database”, a term they apparently invented to distinguish it from everything else. It does appear to be unique, although somewhat similar to other products I’ve seen over the years: Digital Archaeology (now deceased), Omnidex and even QlikView come to mind. Like iLuminate, these systems store links among data values rather than conventional database tables or columnar structures. iLuminate is the purest expression I’ve seen of this approach: it literally stores each value once, regardless of how many tables, columns or rows contain it in the source data. Indexes and algorithms capture the context of each original occurrence so the system can recreate the original records when necessary.
The company is rather vague on the details, perhaps on purpose. They do state that each value is tied to a conventional b-tree index that makes it easily and quickly accessible. What I imagine—and let me stress I may have this wrong—is that each value is then itself tied to a hierarchical list of the tables, columns and rows in which it appears. There would be a count associated with each level, so a query that asked how many times a value appears in each table would simply look at the pre-calculated value counts; a query of how many times the value appeared in a particular column could look down one level to get the column counts. A query that needed to know about individual rows would retrieve the row numbers. A query that involved multiple values would retrieve multiple sets of row numbers and compare them: so, say, a query looking for state = “NY” and eye color = “blue” might find that “NY” appears in the state column for records 3, 21 and 42, while “blue” appears in the eye color for records 5, 21 and 56. It would then return row=21 as the only intersection of the two sets. Another set of indexes would make it simple to retrieve the other components of row 21.
Whether or not that’s what actually happens under the hood, this does illustrate the main advantages of iLuminate. Specifically, it can import data in any structure and access it without formal database design; it can identify instances of the same value across different tables or columns; it can provide instant table and column level value distributions; and it can execute incremental queries against a previously selected set of records. The company also claims high speed and terabyte scalability, although some qualification is needed: initial results from a query appear very quickly, but calculations involving a large result set must wait for the system to assemble and process the full set of data. Foley also said that although the system has been tested with a terabyte of data, the largest production implementation is a much less impressive 50 gigabytes. Still, the largest production row count is 200 million rows – nothing to sneeze at.
The system avoids some of the pitfalls that sometimes trap analytical databases: load times are comparable to load times for comparable relational databases (once you include time for indexing, etc.); total storage (including the indexes, which take up most of the space) is about the same as relational source data; and users can write queries in standard SQL via ODBC. This final point is particularly important, because many past analytical systems were not SQL-compatible. This deterred many potential buyers. The new crop of analytical database vendors has learned this lesson: nearly all of the new analytical systems are SQL-accessible. Just to be clear, iLuminate is not an in-memory database, although it will make intelligent use of what memory is available, often loading the data values and b-tree indexes into memory when possible.
Still, at least from my perspective, the most important feature of iLuminate is its ability to work with any structure of input data—including structures that SQL would handle poorly or not at all. This is where users gain huge time savings, because they need not predict the queries they will write and then design a data structure to support them. In this regard, the system is even more flexible than QlikView, which it in many ways resembles: while QlikView links tables with fixed keys during the data load, iLuminate does not. Instead, like a regular SQL system, iLuminate can apply different relationships to one set of data by defining the relationships within different queries. (On the other hand, QlikView’s powerful scripting language allows much more data manipulation during the load process.)
Part of the reason I mention QlikView is that iLuminate itself uses QlikView as a front-end tool under the label of iAnalyze. This extracts data from iLuminate using ODBC and then loads it into QlikView. Naturally, the data structure at that point must include fixed relationships. In addition to QlikView, iAnalyze also includes integrated mapping. A separate illuminate product, called iCorrelated, allows ad hoc, incremental queries directly against iLuminate and takes full advantage of its special capabilities.
illuminate, which is based in Spain, has been in business for nearly three years. It has more than 40 iLuminate installations, mostly in Europe. Pricing is based on several factors but the entry cost is very reasonable: somewhere in the $80,000 to $100,000 range, including iAnalyze. As part of its U.S. launch, the company is offering no-cost proof of concept projects to qualified customers.
(Yes, the company name is “illuminate” and the product is “iLuminate”. And if you look inside the HTML tag, you’ll see the Internet domain is “i-lluminate.com”. Marketing genius or marketing madness? You decide.)
illuminate calls iLuminate a “correlation database”, a term they apparently invented to distinguish it from everything else. It does appear to be unique, although somewhat similar to other products I’ve seen over the years: Digital Archaeology (now deceased), Omnidex and even QlikView come to mind. Like iLuminate, these systems store links among data values rather than conventional database tables or columnar structures. iLuminate is the purest expression I’ve seen of this approach: it literally stores each value once, regardless of how many tables, columns or rows contain it in the source data. Indexes and algorithms capture the context of each original occurrence so the system can recreate the original records when necessary.
The company is rather vague on the details, perhaps on purpose. They do state that each value is tied to a conventional b-tree index that makes it easily and quickly accessible. What I imagine—and let me stress I may have this wrong—is that each value is then itself tied to a hierarchical list of the tables, columns and rows in which it appears. There would be a count associated with each level, so a query that asked how many times a value appears in each table would simply look at the pre-calculated value counts; a query of how many times the value appeared in a particular column could look down one level to get the column counts. A query that needed to know about individual rows would retrieve the row numbers. A query that involved multiple values would retrieve multiple sets of row numbers and compare them: so, say, a query looking for state = “NY” and eye color = “blue” might find that “NY” appears in the state column for records 3, 21 and 42, while “blue” appears in the eye color for records 5, 21 and 56. It would then return row=21 as the only intersection of the two sets. Another set of indexes would make it simple to retrieve the other components of row 21.
Whether or not that’s what actually happens under the hood, this does illustrate the main advantages of iLuminate. Specifically, it can import data in any structure and access it without formal database design; it can identify instances of the same value across different tables or columns; it can provide instant table and column level value distributions; and it can execute incremental queries against a previously selected set of records. The company also claims high speed and terabyte scalability, although some qualification is needed: initial results from a query appear very quickly, but calculations involving a large result set must wait for the system to assemble and process the full set of data. Foley also said that although the system has been tested with a terabyte of data, the largest production implementation is a much less impressive 50 gigabytes. Still, the largest production row count is 200 million rows – nothing to sneeze at.
The system avoids some of the pitfalls that sometimes trap analytical databases: load times are comparable to load times for comparable relational databases (once you include time for indexing, etc.); total storage (including the indexes, which take up most of the space) is about the same as relational source data; and users can write queries in standard SQL via ODBC. This final point is particularly important, because many past analytical systems were not SQL-compatible. This deterred many potential buyers. The new crop of analytical database vendors has learned this lesson: nearly all of the new analytical systems are SQL-accessible. Just to be clear, iLuminate is not an in-memory database, although it will make intelligent use of what memory is available, often loading the data values and b-tree indexes into memory when possible.
Still, at least from my perspective, the most important feature of iLuminate is its ability to work with any structure of input data—including structures that SQL would handle poorly or not at all. This is where users gain huge time savings, because they need not predict the queries they will write and then design a data structure to support them. In this regard, the system is even more flexible than QlikView, which it in many ways resembles: while QlikView links tables with fixed keys during the data load, iLuminate does not. Instead, like a regular SQL system, iLuminate can apply different relationships to one set of data by defining the relationships within different queries. (On the other hand, QlikView’s powerful scripting language allows much more data manipulation during the load process.)
Part of the reason I mention QlikView is that iLuminate itself uses QlikView as a front-end tool under the label of iAnalyze. This extracts data from iLuminate using ODBC and then loads it into QlikView. Naturally, the data structure at that point must include fixed relationships. In addition to QlikView, iAnalyze also includes integrated mapping. A separate illuminate product, called iCorrelated, allows ad hoc, incremental queries directly against iLuminate and takes full advantage of its special capabilities.
illuminate, which is based in Spain, has been in business for nearly three years. It has more than 40 iLuminate installations, mostly in Europe. Pricing is based on several factors but the entry cost is very reasonable: somewhere in the $80,000 to $100,000 range, including iAnalyze. As part of its U.S. launch, the company is offering no-cost proof of concept projects to qualified customers.
Thursday, March 27, 2008
The Limits of On-Demand Business Intelligence
I had an email yesterday from Blink Logic , which offers on-demand business intelligence. That could mean quite a few things but the most likely definition is indeed what Blink Logic provides: remote access to business intelligence software loaded with your own data. I looked a bit further and it appears Blink Logic does this with conventional technologies, primarily Microsoft SQL Server Analysis Services and Cognos Series 7.
At that point I pretty much lost interest because (a) there’s no exotic technology, (b) quite a few vendors offer similar services*, and (c) the real issue with business intelligence is the work required to prepare the data for analysis, which doesn’t change just because the system is hosted.
Now, this might be unfair to Blink Logic, which could have some technology of its own for data loading or the user interface. It does claim that at least one collaboration feature, direct annotation of data in reports, is unique. But the major point remains: Blink Logic and other “on-demand business intelligence” vendors are simply offering a hosted version of standard business intelligence systems. Does anyone truly think the location of the data center is the chief reason that business intelligence has so few users?
As I see it, the real obstacle is that most source data must be integrated and restructured before business intelligence systems can use it. It may be literally true that hosted business intelligence systems can be deployed in days and users can build dashboards in minutes, but this only applies given the heroic assumption that the proper data is already available. Under those conditions, on-premise systems can be deployed and used just as quickly. Hosting per se has little benefit when it comes to speed of deployment. (Well, maybe some: it can take days or even a week or two to set up a new server in some corporate data centers. Still, that is a tiny fraction of the typical project schedule.)
If hosting isn't the answer, what can make true “business intelligence on demand” a reality? Since the major obstacle is data preparation, then anything that allows less preparation will help. This brings us back to the analytical databases and appliances I’ve been writing about recently : Alterian, Vertica, ParAccel, QlikView, Netezza and so on. At least some of them do reduce the need for preparation because they let users query raw data without restructuring it or aggregating it. This isn’t because they avoid SQL queries, but because they offer a great enough performance boost over conventional databases that aggregation or denormalization are not necessary to return results quickly.
Of course, performance alone can’t solve all data preparation problems. The really knotty challenges like customer data integration and data quality still remain. Perhaps some of those will be addressed by making data accessible as a service (see last week’s post). But services themselves do not appear automatically, so a business intelligence application that requires a new service will still need advance planning. Where services will help is when business intelligence users can take advantage of services created for operational purposes.
“On demand business intelligence” also requires that end-users be able to do more for themselves. I actually feel this is one area where conventional technology is largely adequate: although systems could always be easier, end-users willing to invest a bit of time can already create useful dashboards, reports and analyses without deep technical skills. There are still substantial limits to what can be done – this is where QlikView’s scripting and macro capabilities really add value by giving still more power to non-technical users (or, more precisely, to power users outside the IT department). Still, I’d say that when the necessary data is available, existing business intelligence tools let users accomplish most of what they want.
If there is an issue in this area, it’s that SQL-based analytical databases don’t usually include an end-user access tool. (Non-SQL systems do provide such tools, since users have no alternatives.) This is a reasonable business decision on their part, both because many firms have already selected a standard access tool and because the vendors don’t want to invest in a peripheral technology. But not having an integrated access tool means clients must take time to connect the database to another product, which does slow things down. Apparently I'm not the only person to notice this: some of the analytical vendors are now developing partnerships with access tool vendors. If they can automate the relationship so that data sources become visible in the access tool as soon as they are added to the analytical system, this will move “on demand business intelligence” one step closer to reality.
* results of a quick Google search: OnDemandIQ, LucidEra, PivotLink (an in-memory columnar database), oco, VisualSmart, GoodData and
Autometrics.
At that point I pretty much lost interest because (a) there’s no exotic technology, (b) quite a few vendors offer similar services*, and (c) the real issue with business intelligence is the work required to prepare the data for analysis, which doesn’t change just because the system is hosted.
Now, this might be unfair to Blink Logic, which could have some technology of its own for data loading or the user interface. It does claim that at least one collaboration feature, direct annotation of data in reports, is unique. But the major point remains: Blink Logic and other “on-demand business intelligence” vendors are simply offering a hosted version of standard business intelligence systems. Does anyone truly think the location of the data center is the chief reason that business intelligence has so few users?
As I see it, the real obstacle is that most source data must be integrated and restructured before business intelligence systems can use it. It may be literally true that hosted business intelligence systems can be deployed in days and users can build dashboards in minutes, but this only applies given the heroic assumption that the proper data is already available. Under those conditions, on-premise systems can be deployed and used just as quickly. Hosting per se has little benefit when it comes to speed of deployment. (Well, maybe some: it can take days or even a week or two to set up a new server in some corporate data centers. Still, that is a tiny fraction of the typical project schedule.)
If hosting isn't the answer, what can make true “business intelligence on demand” a reality? Since the major obstacle is data preparation, then anything that allows less preparation will help. This brings us back to the analytical databases and appliances I’ve been writing about recently : Alterian, Vertica, ParAccel, QlikView, Netezza and so on. At least some of them do reduce the need for preparation because they let users query raw data without restructuring it or aggregating it. This isn’t because they avoid SQL queries, but because they offer a great enough performance boost over conventional databases that aggregation or denormalization are not necessary to return results quickly.
Of course, performance alone can’t solve all data preparation problems. The really knotty challenges like customer data integration and data quality still remain. Perhaps some of those will be addressed by making data accessible as a service (see last week’s post). But services themselves do not appear automatically, so a business intelligence application that requires a new service will still need advance planning. Where services will help is when business intelligence users can take advantage of services created for operational purposes.
“On demand business intelligence” also requires that end-users be able to do more for themselves. I actually feel this is one area where conventional technology is largely adequate: although systems could always be easier, end-users willing to invest a bit of time can already create useful dashboards, reports and analyses without deep technical skills. There are still substantial limits to what can be done – this is where QlikView’s scripting and macro capabilities really add value by giving still more power to non-technical users (or, more precisely, to power users outside the IT department). Still, I’d say that when the necessary data is available, existing business intelligence tools let users accomplish most of what they want.
If there is an issue in this area, it’s that SQL-based analytical databases don’t usually include an end-user access tool. (Non-SQL systems do provide such tools, since users have no alternatives.) This is a reasonable business decision on their part, both because many firms have already selected a standard access tool and because the vendors don’t want to invest in a peripheral technology. But not having an integrated access tool means clients must take time to connect the database to another product, which does slow things down. Apparently I'm not the only person to notice this: some of the analytical vendors are now developing partnerships with access tool vendors. If they can automate the relationship so that data sources become visible in the access tool as soon as they are added to the analytical system, this will move “on demand business intelligence” one step closer to reality.
* results of a quick Google search: OnDemandIQ, LucidEra, PivotLink (an in-memory columnar database), oco, VisualSmart, GoodData and
Autometrics.
Thursday, March 20, 2008
Service Oriented Architectures Might Really Change Everything
I put in a brief but productive appearance at the DAMA International Symposium and Wilshire Meta-Data Conference running this week in San Diego. This is THE event for people who care passionately about topics like “A Semantic-Driven Application for Master Data Management” and “Dimensional-Modeling – Alternative Designs for Slowly Changing Dimensions”. As you might imagine, there aren't that many of them, and it’s always clear that the attendees revel in spending time with others in their field. I’m sure there are some hilarious data modeling jokes making the rounds at the show, but I wasn’t able to stick around long enough to hear any.
One of the few sessions I did catch was a keynote by Gartner Vice President Michael Blechar. His specific topic was the impact of a services-driven architecture on data management, with the general point being that services depend on data being easily available for many different purposes, rather than tied to individual applications as in the past. This means that the data feeding into those services must be redesigned to fit this broader set of uses.
In any case, what struck me was Blechar’s statement the fundamental way I’ve always thought about systems is now obsolete. I've always thought that systems do three basic things: accept inputs, process them, and create outputs. This doesn't apply in the new world, where services are strung together to handle specific processes. The services themselves handle the data gathering, processing and outputs, so these occur repeatedly as the process moves from one service to another. (Of course, a system can still have its own processing logic that exists outside a service.) But what’s really new is that a single service may be used in several different processes. This means that services are not simply components within a particular proces or system: they have an independent existence of their own.
Exactly how you create and manage these process-independent services is a bit of a mystery to me. After all, you still have to know they will meet the requirements of whatever processes will use them. Presumably this means those requirements must be developed the old fashioned way: by defining the process flow in detail. Any subtle differences in what separate processes need from the same service must be accommodated either by making the service more flexible (for example, adding some parameters that specify how it will function in a particular case) or by adding specialized processing outside of the service. I'll assume that the people who worry about these things for a living must have recognized this long ago and worked out their answers.
What matters to me is what an end-user can do once these services exist. Blechar argued that users now view their desktop as a “composition platform” that combines many different services and uses the results to orchestrate business processes. He saw executive dashboards in particular as evolving from business intelligence systems (based on a data warehouse or data mart) to business activity monitoring based on the production systems themselves. This closer connection to actual activity would in turn allow the systems to be more “context aware”—for example, issuing alerts and taking actions based on current workloads and performance levels.
Come to think of it, my last post discussed eglue and others doing exactly this to manage customer interactions. What a more comprehensive set of services should do is make it easer to set up this type of context-aware decision making.
Somewhat along these same lines, Computerworld this morning describes another Gartner paper arguing that IT’s role in business intelligence will be “marginalized” by end-users creating their own business intelligence systems using tools like enterprise search, visualization and in-memory analytics (hello, QlikView!). The four reader comments posted so far have been not-so-politely skeptical of this notion, basically because they feel IT will still do all the heavy lifting of building the databases that provide information for these user-built systems. This is correct as far as it goes, but it misses the point that IT will be exposing this data as services for operational reasons anyway. In that case, no additional IT work is needed to make it available for business intelligence. Once end-users have self-service tools to access and analyze the data provided by these operational services, business intelligence systems would emerge without IT involvement. I'd say that counts as "marginalized".
Just to bring these thoughts full circle: this means that designing business intelligence systems with the old “define inputs, define processes, define outputs” model would indeed be obsolete. The inputs would already be available as services, while the processes and outputs would be created simultaneously in end-user tools. I’m not quite sure I really believe this is going to happen, but it’s definitely food for thought.
One of the few sessions I did catch was a keynote by Gartner Vice President Michael Blechar. His specific topic was the impact of a services-driven architecture on data management, with the general point being that services depend on data being easily available for many different purposes, rather than tied to individual applications as in the past. This means that the data feeding into those services must be redesigned to fit this broader set of uses.
In any case, what struck me was Blechar’s statement the fundamental way I’ve always thought about systems is now obsolete. I've always thought that systems do three basic things: accept inputs, process them, and create outputs. This doesn't apply in the new world, where services are strung together to handle specific processes. The services themselves handle the data gathering, processing and outputs, so these occur repeatedly as the process moves from one service to another. (Of course, a system can still have its own processing logic that exists outside a service.) But what’s really new is that a single service may be used in several different processes. This means that services are not simply components within a particular proces or system: they have an independent existence of their own.
Exactly how you create and manage these process-independent services is a bit of a mystery to me. After all, you still have to know they will meet the requirements of whatever processes will use them. Presumably this means those requirements must be developed the old fashioned way: by defining the process flow in detail. Any subtle differences in what separate processes need from the same service must be accommodated either by making the service more flexible (for example, adding some parameters that specify how it will function in a particular case) or by adding specialized processing outside of the service. I'll assume that the people who worry about these things for a living must have recognized this long ago and worked out their answers.
What matters to me is what an end-user can do once these services exist. Blechar argued that users now view their desktop as a “composition platform” that combines many different services and uses the results to orchestrate business processes. He saw executive dashboards in particular as evolving from business intelligence systems (based on a data warehouse or data mart) to business activity monitoring based on the production systems themselves. This closer connection to actual activity would in turn allow the systems to be more “context aware”—for example, issuing alerts and taking actions based on current workloads and performance levels.
Come to think of it, my last post discussed eglue and others doing exactly this to manage customer interactions. What a more comprehensive set of services should do is make it easer to set up this type of context-aware decision making.
Somewhat along these same lines, Computerworld this morning describes another Gartner paper arguing that IT’s role in business intelligence will be “marginalized” by end-users creating their own business intelligence systems using tools like enterprise search, visualization and in-memory analytics (hello, QlikView!). The four reader comments posted so far have been not-so-politely skeptical of this notion, basically because they feel IT will still do all the heavy lifting of building the databases that provide information for these user-built systems. This is correct as far as it goes, but it misses the point that IT will be exposing this data as services for operational reasons anyway. In that case, no additional IT work is needed to make it available for business intelligence. Once end-users have self-service tools to access and analyze the data provided by these operational services, business intelligence systems would emerge without IT involvement. I'd say that counts as "marginalized".
Just to bring these thoughts full circle: this means that designing business intelligence systems with the old “define inputs, define processes, define outputs” model would indeed be obsolete. The inputs would already be available as services, while the processes and outputs would be created simultaneously in end-user tools. I’m not quite sure I really believe this is going to happen, but it’s definitely food for thought.
Tuesday, March 11, 2008
eglue Links Data to Improve Customer Interactions
Let me tell you a story.
For years, United Parcel Service refused to invest in the tracking systems and other technologies that made Federal Express a preferred carrier for many small package shippers. It wasn’t that the people at UPS were stupid: to the contrary, they had built such incredibly efficient manual systems that they could never see how automated systems would generate enough added value to cover their cost. Then, finally, some studies came out the other way. Overnight, UPS expanded its IT department from 300 people to 3,000 people (these may not be the exact numbers). Today, UPS technology is every bit as good as its rivals’ and the company is more dominant in its industry than ever.
The point of this story—well, one point anyway—is that innovations which look sensible to outsiders often don’t get adopted because they don’t add enough value to an already well-run organization. (I could take this a step further to suggest that once the added value does exceed costs, a “tipping point” is reached and adoption rates will soar. Unfortunately, I haven’t seen this in reality. Nice theory, though.)
This brings us to eglue, which offers “real time interaction management” (my term, not theirs): that is, it helps call center agents, Web sites and other customer-facing systems to offer the right treatment at each point during an interaction. The concept has been around for years and has consistently demonstrated substantial value. But adoption rates have been perplexingly low.
We’ll get back to adoption rates later, although I should probably note right here that eglue has doubled its business for each of the past three years. First, let’s take a closer look at the product itself.
To repeat, the basic function of eglue is making recommendations during real time interactions. Specifically, the system adds this capability to existing applications with a minimum of integration effort. Indeed, being “minimally invasive” (their term) is a major selling point, and does address one of the significant barriers to adopting interaction management systems. Eglue can use standard database queries or Web services calls to capture interaction data. But its special approach is what it calls “GUI monitoring”—reading data from the user interface without any deeper connection to the underlying systems. Back in the day, we used to call this “screen scraping”, although I assume eglue’s approach is much more sophisticated.
As eglue captures information about an on-going interaction, it applies rules and scoring models to decide what to recommend. These rules are set up by business users, taking advantage of data connections prepared in advance by technical staff. This is as it should be: business users should not need IT assistance to make day-to-day rule changes.
On the other hand, a sophisticated business environment involves lots of possible business rules, and business users only have so much time or capacity to understand all the interconnections. Eglue is a bit limited here: unlike some other interaction management systems, it does not automatically generate recommended rules or update its scoring models as data is received.
This may or may not be a weakness. How much automation makes sense is a topic of heated debate among people who care about such things. User-generated rules are more reliable than unsupervised automation, but they also take more effort and can’t react immediately to changes in customer behavior. I personally feel eglue’s heavy reliance on rules is a disadvantage, though a minor one. eglue does provide a number of prebuilt applications for specific tasks, so clients need not build their own rules from scratch.
What impressed me more about eglue was that its rules can take into account not only the customer’s own behavior, both during and before the interaction, but also the local context (e.g., the current workload and wait times at the call center) and the individual agent on the other end of the phone. Thus, agents with a history of doing well at selling a particular product are provided more recommendations for that product. Or the system could restrict recommendations for complex products to experienced agents who are capable of handling them. eglue rules can also alert supervisors about relationships between agents and interactions. For example, it might tell a supervisor when a high value customer is talking to an inexperienced agent, so she can listen and intervene if necessary.
The interface for presenting the recommendations is also quite appealing. Recommendations appear as pop-ups on the user’s screen, which makes them stand out nicely. More important, they provide a useful range of information: the recommendation itself, selling points (which can be tailored to the customer and agent), a mechanism to capture feedback (was the recommended offer presented to the customer? Did she accept or reject it?), and links to additional information such as product features. There is an option to copy information into another application—for example, saving the effort to type a customer’s name or account information into an order processing system. As anyone who has had to repeat their phone number three times during the course of a simple transaction can attest—and that would be all of us—that feature alone is worth the price of admission. The pop-up can also show the business rule that triggered a recommendation and the data that rule is using.
As each interaction progresses, eglue automatically captures information about the offers it has recommended and customer response. This information can be used in reports, applied to model development, and added to customer profiles to guide future recommendations. It can also be fed back into other corporate systems.
The price for all this is not insignificant. Eglue costs about $1,000 to $1,200 per seat, depending on the details. However, this is probably in line with competitors like Chordiant, Pegasystems, and Portrait Software. eglue targets call centers with 250 to 300 seats; indeed, its 30+ clients are all Fortune 1000 firms. Its largest installation has 20,000 seats. The company’s “GUI monitoring” approach to integration and prebuilt applications allow it to complete an implementation in a relatively speedy 8 to 12 weeks.
This brings us back, in admittedly roundabout fashion, to the original question: why don’t more companies use this technology? The benefits are well documented—one eglue case study showed a 27% increase in revenue per call at Key Bank, and every other vendor has similar stories. The cost is reasonable and implementation gets easier all the time. But although eglue and its competitors have survived and grown on a small scale, this class of software is still far from ubiquitous.
My usual theory is lack of interest by call center managers: they don’t see revenue generation as their first priority, even though they may be expected to do some of it. But eglue and its competitors can be used for training, compliance and other applications that are closer to a call center manager’s heart. There is always the issue of data integration, but that keeps getting easier as newer technologies are deployed, and it doesn’t take much data to generate effective recommendations. Another theory, echoing the UPS story, is that existing call center applications have enough built-in capabilities to make investment in a specialized recommendation system uneconomic. I’m guessing that answer may be the right one.
But I’ll leave the last word to Hovav Lapidot, eglue’s Vice President of Product Marketing and a six-year company veteran. His explanation was that the move to overseas outsourced call centers over the past decade reflected a narrow focus on cost reduction. Neither the corporate managers doing the outsourcing nor the vendors competing on price were willing to pay more for the revenue-generation capabilities of interaction management systems. But Lapidot says this has been changing: some companies are bringing work back from overseas in the face of customer unhappiness, and managers are showing more interest in the potential value of inbound interactions.
The ultimate impact of interaction management software is to create a better experience for customers like you and me. So let’s all hope he’s right.
For years, United Parcel Service refused to invest in the tracking systems and other technologies that made Federal Express a preferred carrier for many small package shippers. It wasn’t that the people at UPS were stupid: to the contrary, they had built such incredibly efficient manual systems that they could never see how automated systems would generate enough added value to cover their cost. Then, finally, some studies came out the other way. Overnight, UPS expanded its IT department from 300 people to 3,000 people (these may not be the exact numbers). Today, UPS technology is every bit as good as its rivals’ and the company is more dominant in its industry than ever.
The point of this story—well, one point anyway—is that innovations which look sensible to outsiders often don’t get adopted because they don’t add enough value to an already well-run organization. (I could take this a step further to suggest that once the added value does exceed costs, a “tipping point” is reached and adoption rates will soar. Unfortunately, I haven’t seen this in reality. Nice theory, though.)
This brings us to eglue, which offers “real time interaction management” (my term, not theirs): that is, it helps call center agents, Web sites and other customer-facing systems to offer the right treatment at each point during an interaction. The concept has been around for years and has consistently demonstrated substantial value. But adoption rates have been perplexingly low.
We’ll get back to adoption rates later, although I should probably note right here that eglue has doubled its business for each of the past three years. First, let’s take a closer look at the product itself.
To repeat, the basic function of eglue is making recommendations during real time interactions. Specifically, the system adds this capability to existing applications with a minimum of integration effort. Indeed, being “minimally invasive” (their term) is a major selling point, and does address one of the significant barriers to adopting interaction management systems. Eglue can use standard database queries or Web services calls to capture interaction data. But its special approach is what it calls “GUI monitoring”—reading data from the user interface without any deeper connection to the underlying systems. Back in the day, we used to call this “screen scraping”, although I assume eglue’s approach is much more sophisticated.
As eglue captures information about an on-going interaction, it applies rules and scoring models to decide what to recommend. These rules are set up by business users, taking advantage of data connections prepared in advance by technical staff. This is as it should be: business users should not need IT assistance to make day-to-day rule changes.
On the other hand, a sophisticated business environment involves lots of possible business rules, and business users only have so much time or capacity to understand all the interconnections. Eglue is a bit limited here: unlike some other interaction management systems, it does not automatically generate recommended rules or update its scoring models as data is received.
This may or may not be a weakness. How much automation makes sense is a topic of heated debate among people who care about such things. User-generated rules are more reliable than unsupervised automation, but they also take more effort and can’t react immediately to changes in customer behavior. I personally feel eglue’s heavy reliance on rules is a disadvantage, though a minor one. eglue does provide a number of prebuilt applications for specific tasks, so clients need not build their own rules from scratch.
What impressed me more about eglue was that its rules can take into account not only the customer’s own behavior, both during and before the interaction, but also the local context (e.g., the current workload and wait times at the call center) and the individual agent on the other end of the phone. Thus, agents with a history of doing well at selling a particular product are provided more recommendations for that product. Or the system could restrict recommendations for complex products to experienced agents who are capable of handling them. eglue rules can also alert supervisors about relationships between agents and interactions. For example, it might tell a supervisor when a high value customer is talking to an inexperienced agent, so she can listen and intervene if necessary.
The interface for presenting the recommendations is also quite appealing. Recommendations appear as pop-ups on the user’s screen, which makes them stand out nicely. More important, they provide a useful range of information: the recommendation itself, selling points (which can be tailored to the customer and agent), a mechanism to capture feedback (was the recommended offer presented to the customer? Did she accept or reject it?), and links to additional information such as product features. There is an option to copy information into another application—for example, saving the effort to type a customer’s name or account information into an order processing system. As anyone who has had to repeat their phone number three times during the course of a simple transaction can attest—and that would be all of us—that feature alone is worth the price of admission. The pop-up can also show the business rule that triggered a recommendation and the data that rule is using.
As each interaction progresses, eglue automatically captures information about the offers it has recommended and customer response. This information can be used in reports, applied to model development, and added to customer profiles to guide future recommendations. It can also be fed back into other corporate systems.
The price for all this is not insignificant. Eglue costs about $1,000 to $1,200 per seat, depending on the details. However, this is probably in line with competitors like Chordiant, Pegasystems, and Portrait Software. eglue targets call centers with 250 to 300 seats; indeed, its 30+ clients are all Fortune 1000 firms. Its largest installation has 20,000 seats. The company’s “GUI monitoring” approach to integration and prebuilt applications allow it to complete an implementation in a relatively speedy 8 to 12 weeks.
This brings us back, in admittedly roundabout fashion, to the original question: why don’t more companies use this technology? The benefits are well documented—one eglue case study showed a 27% increase in revenue per call at Key Bank, and every other vendor has similar stories. The cost is reasonable and implementation gets easier all the time. But although eglue and its competitors have survived and grown on a small scale, this class of software is still far from ubiquitous.
My usual theory is lack of interest by call center managers: they don’t see revenue generation as their first priority, even though they may be expected to do some of it. But eglue and its competitors can be used for training, compliance and other applications that are closer to a call center manager’s heart. There is always the issue of data integration, but that keeps getting easier as newer technologies are deployed, and it doesn’t take much data to generate effective recommendations. Another theory, echoing the UPS story, is that existing call center applications have enough built-in capabilities to make investment in a specialized recommendation system uneconomic. I’m guessing that answer may be the right one.
But I’ll leave the last word to Hovav Lapidot, eglue’s Vice President of Product Marketing and a six-year company veteran. His explanation was that the move to overseas outsourced call centers over the past decade reflected a narrow focus on cost reduction. Neither the corporate managers doing the outsourcing nor the vendors competing on price were willing to pay more for the revenue-generation capabilities of interaction management systems. But Lapidot says this has been changing: some companies are bringing work back from overseas in the face of customer unhappiness, and managers are showing more interest in the potential value of inbound interactions.
The ultimate impact of interaction management software is to create a better experience for customers like you and me. So let’s all hope he’s right.
Wednesday, February 27, 2008
ParAccel Enters the Analytical Database Race
As I’ve now written more times than I care to admit, specialized analytical databases are very much in style. In addition to my beloved QlikView, market entrants include Alterian, SmartFocus, QD Technology, Vertica, 1010data, Kognitio, Advizor and Polyhedra, not to mention established standbys including Teradata and Sybase IQ. Plus you have to add appliances like Netezza, Calpont, Greenplum and DATAllegro. Many of these run on massively parallel hardware platforms; several use columnar data structures and in-memory data access. It’s all quite fascinating, but after a while even I tend to lose interest in the details.
None of which dimmed my enthusiasm when I learned about yet another analytical database vendor, ParAccel. Sure enough, ParAccel is a massively parallel, in-memory-capable, SQL-compatible columnar database, which pretty much hits all the tick boxes on my list. Run by industry veterans, the company seems to have refined many of the details that will let it scale linearly with large numbers of processors and extreme data volumes. One point that seemed particularly noteworthy was that the standard data loader can handle 700 GB per hour, which is vastly faster than many columnar systems and can be a major stumbling block. And that’s just the standard loader, which passes all data through a single node: for really large volumes, the work can be shared among multiple nodes.
Still, if ParAccel had one particularly memorable claim to my attention, it was having blown past previous records for several of the TPC-H analytical query benchmarks run by the Transaction Processing Council. The TPC process is grueling and many vendors don’t bother with it, but it still carries some weight as one of the few objective performance standards available. While other winners had beaten the previous marks by a few percentage points, ParAccel's improvement was on the order of 500%.
When I looked at the TPC-H Website for details, it turned out that ParAccel’s winning results have since been bested by yet another massively parallel database vendor, EXASOL, based in Nuremberg, Germany. (Actually, ParAccel is still listed by TPC as best in the 300 GB category, but that’s apparently only because EXASOL has only run the 100 GB and 1 TB tests.) Still, none of the other analytic database vendors seem to have attempted the TPC-H process, so I’m not sure how impressed to be by ParAccel’s performance. Sure it clearly beats the pants off Oracle, DB2 and SQL Server, but any columnar database should be able to do that.
One insight I did gain from my look at ParAccel was that in-memory doesn’t need to mean small. I’ll admit to be used to conventional PC servers, where 16 GB of memory is a lot and 64 GB is definitely pushing it. The massively parallel systems are a whole other ballgame: ParAccel’s 1 TB test ran on a 48 node system. At a cost of maybe $10,000 per node, that’s some pretty serious hardware, so this is not something that will replace QlikView under my desk any time soon. And bear in mind that even a terabyte isn’t really that much these days: as a point of reference, the TPC-H goes up to 30 TB. Try paying for that much memory, massively parallel or not. The goods news is that ParAccel can work with on-disk as well as in-memory data, although the performance won’t be quite as exciting. Hence the term "in-memory-capable".
Hardware aside, ParAccel itself is not especially cheap either. The entry price is $210,000, which buys licenses for five nodes and a terabyte of data. Licenses cost $40,000 for each additional node cost $40,000 and $10,000 for each additional terabyte. An alternative pricing scheme doesn’t charge for nodes but costs $1,000 per GB, which is also a good bit of money. Subscription pricing is available, but any way you slice it, this is not a system for small businesses.
So is ParAccel the cat’s meow of analytical databases? Well, maybe, but only because I’m not sure what “the cat’s meow” really means. It’s surely an alternative worth considering for anyone in the market. Perhaps more significant, the company raised $20 million December 2007, which may make it more commercially viable than most. Even in a market as refined as this one, commercial considerations will ultimately be more important than pure technical excellence.
None of which dimmed my enthusiasm when I learned about yet another analytical database vendor, ParAccel. Sure enough, ParAccel is a massively parallel, in-memory-capable, SQL-compatible columnar database, which pretty much hits all the tick boxes on my list. Run by industry veterans, the company seems to have refined many of the details that will let it scale linearly with large numbers of processors and extreme data volumes. One point that seemed particularly noteworthy was that the standard data loader can handle 700 GB per hour, which is vastly faster than many columnar systems and can be a major stumbling block. And that’s just the standard loader, which passes all data through a single node: for really large volumes, the work can be shared among multiple nodes.
Still, if ParAccel had one particularly memorable claim to my attention, it was having blown past previous records for several of the TPC-H analytical query benchmarks run by the Transaction Processing Council. The TPC process is grueling and many vendors don’t bother with it, but it still carries some weight as one of the few objective performance standards available. While other winners had beaten the previous marks by a few percentage points, ParAccel's improvement was on the order of 500%.
When I looked at the TPC-H Website for details, it turned out that ParAccel’s winning results have since been bested by yet another massively parallel database vendor, EXASOL, based in Nuremberg, Germany. (Actually, ParAccel is still listed by TPC as best in the 300 GB category, but that’s apparently only because EXASOL has only run the 100 GB and 1 TB tests.) Still, none of the other analytic database vendors seem to have attempted the TPC-H process, so I’m not sure how impressed to be by ParAccel’s performance. Sure it clearly beats the pants off Oracle, DB2 and SQL Server, but any columnar database should be able to do that.
One insight I did gain from my look at ParAccel was that in-memory doesn’t need to mean small. I’ll admit to be used to conventional PC servers, where 16 GB of memory is a lot and 64 GB is definitely pushing it. The massively parallel systems are a whole other ballgame: ParAccel’s 1 TB test ran on a 48 node system. At a cost of maybe $10,000 per node, that’s some pretty serious hardware, so this is not something that will replace QlikView under my desk any time soon. And bear in mind that even a terabyte isn’t really that much these days: as a point of reference, the TPC-H goes up to 30 TB. Try paying for that much memory, massively parallel or not. The goods news is that ParAccel can work with on-disk as well as in-memory data, although the performance won’t be quite as exciting. Hence the term "in-memory-capable".
Hardware aside, ParAccel itself is not especially cheap either. The entry price is $210,000, which buys licenses for five nodes and a terabyte of data. Licenses cost $40,000 for each additional node cost $40,000 and $10,000 for each additional terabyte. An alternative pricing scheme doesn’t charge for nodes but costs $1,000 per GB, which is also a good bit of money. Subscription pricing is available, but any way you slice it, this is not a system for small businesses.
So is ParAccel the cat’s meow of analytical databases? Well, maybe, but only because I’m not sure what “the cat’s meow” really means. It’s surely an alternative worth considering for anyone in the market. Perhaps more significant, the company raised $20 million December 2007, which may make it more commercially viable than most. Even in a market as refined as this one, commercial considerations will ultimately be more important than pure technical excellence.
Thursday, February 14, 2008
What's New at DataFlux? I Thought You'd Never Ask.
What with it being Valentine’s Day and all, you probably didn’t wake up this morning asking yourself, “I wonder what’s new with DataFlux?” That, my friend, is where you and I differ. Except that I actually asked myself that question a couple of weeks ago, and by now have had time to get an answer. Which turns out to be rather interesting.
DataFlux, as anyone still reading this probably knew already, is a developer of data quality software and is owned by SAS. DataFlux’s original core technology was a statistical matching engine that automatically analyzes input files and generates sophisticated keys which are similar for similar records. This has now been supplemented by a variety of capabilities for data profiling, analysis, standardization and verification, using reference data and rules in addition to statistical methods. The original matching engine is now just one component within a much larger set of solutions.
In fact, and this is what I find interesting, much of DataFlux’s focus is now on the larger issue of data governance. This has more to do with monitoring data quality than simple matching. DataFlux tells me the change has been driven by organizations that face increasing pressures to prove they are doing a good job with managing their data, for reasons such as financial reporting and compliance with government regulations.
The new developments also encompass product information and other types of non-name and address data, usually labeled as “master data management”. DataFlux reports that non-customer data is is the fastest growing portion of its business. DataFlux is well suited for non-traditional matching applications because the statistical approach does not rely on topic-specific rules and reference bases. Of course, DataFlux does use rules and reference information when appropriate.
The other recent development at DataFlux has been creation of “accelerators”, which are prepackaged rules, processes and reports for specific tasks. DataFlux started offering these in 2007 and now lists one each for customer data quality, product data quality, and watchlist compliance. More are apparently on the way. Applications like this are a very common development in a maturing industry, as companies that started by providing tools gain enough experience to understand how the applications commonly built with those tools. The next step—which DataFlux hasn’t reached yet—is to become even more specific by developing packages for particular industries. The benefit of these applications is that they save clients work and allow quicker deployments.
Back to governance. DataFlux’s movement in that direction is an interesting strategy because it offers a possible escape from the commoditization of its core data quality functions. Major data quality vendors including Firstlogic and Group 1 Software, plus several of the smaller ones, have been acquired in recent years and matching functions are now embedded within many enterprise software products. Even though there have been some intriguing new technical approaches from vendors like Netrics and Zoomix, this is a hard market to penetrate based on better technology alone. It seems that DataFlux moved into governance more in response to customer requests than due to proactive strategic planning. But even so, they have done well to recognize and seize the opportunity when it presented itself. Not everyone is quite so responsive. The question now is whether other data quality vendors will take a similar approach or this will be a long-term point of differentiation for DataFlux.
DataFlux, as anyone still reading this probably knew already, is a developer of data quality software and is owned by SAS. DataFlux’s original core technology was a statistical matching engine that automatically analyzes input files and generates sophisticated keys which are similar for similar records. This has now been supplemented by a variety of capabilities for data profiling, analysis, standardization and verification, using reference data and rules in addition to statistical methods. The original matching engine is now just one component within a much larger set of solutions.
In fact, and this is what I find interesting, much of DataFlux’s focus is now on the larger issue of data governance. This has more to do with monitoring data quality than simple matching. DataFlux tells me the change has been driven by organizations that face increasing pressures to prove they are doing a good job with managing their data, for reasons such as financial reporting and compliance with government regulations.
The new developments also encompass product information and other types of non-name and address data, usually labeled as “master data management”. DataFlux reports that non-customer data is is the fastest growing portion of its business. DataFlux is well suited for non-traditional matching applications because the statistical approach does not rely on topic-specific rules and reference bases. Of course, DataFlux does use rules and reference information when appropriate.
The other recent development at DataFlux has been creation of “accelerators”, which are prepackaged rules, processes and reports for specific tasks. DataFlux started offering these in 2007 and now lists one each for customer data quality, product data quality, and watchlist compliance. More are apparently on the way. Applications like this are a very common development in a maturing industry, as companies that started by providing tools gain enough experience to understand how the applications commonly built with those tools. The next step—which DataFlux hasn’t reached yet—is to become even more specific by developing packages for particular industries. The benefit of these applications is that they save clients work and allow quicker deployments.
Back to governance. DataFlux’s movement in that direction is an interesting strategy because it offers a possible escape from the commoditization of its core data quality functions. Major data quality vendors including Firstlogic and Group 1 Software, plus several of the smaller ones, have been acquired in recent years and matching functions are now embedded within many enterprise software products. Even though there have been some intriguing new technical approaches from vendors like Netrics and Zoomix, this is a hard market to penetrate based on better technology alone. It seems that DataFlux moved into governance more in response to customer requests than due to proactive strategic planning. But even so, they have done well to recognize and seize the opportunity when it presented itself. Not everyone is quite so responsive. The question now is whether other data quality vendors will take a similar approach or this will be a long-term point of differentiation for DataFlux.
Wednesday, February 06, 2008
Red Herring CMO Conference: What Do Marketers Really Want?
I’ve spent the last two days at Red Herring Magazine’s CMO8 conference, which was both excellent and a welcome change from my usual focus on the nuts and bolts of marketing systems. Reflecting Red Herring’s own audience, the speakers and audience were largely from technology companies and many presentations were about business-to-business rather than business to consumer marketing. My particular favorites included AMD’s Stephen DiFranco, Ingram Micro’s Carol Kurimsky, and Lenovo’s Deepak Advani. DiFranco discussed how AMD manages to survive in the face of Intel’s overwhelming market position by focusing on gaining shelf space at retail and through other channel partners. Kurimsky described how her firm uses analytics to identify the best channel partners for her suppliers. Advani gave an overview of how Lenovo very systematically managed the transition of the ThinkPad brand from IBM’s ownership and simulataneously built Lenovo’s own brand. Although each described different challenges and solutions, they all shared a very strategic, analytical approach to marketing issues.
Personally I found this anything but surprising. All the good marketers I’ve ever known have been disciplined, strategic thinkers. Apparently, this is not always the case in the technology industry. Many in this audience seemed to accept the common stereotype of marketers as too often focused on creativity rather than business value. And, despite the prominent exception of Advani’s presentation, there seemed to be considerable residual skepticism of the value provided by brand marketing in particular.
The group did seem heartened at the notion, repeated several times, that a new generation of analytically-minded marketers is on the rise. Yet I have to wonder: the worst attended session I saw was an excellent panel on marketing performance measurement. This featured Alex Eldemir of MarketingNPV, Stephen DiMarco of Compete, Inc., Laura Patterson of VisionEdge Marketing, and Michael Emerson of Aprimo. The gist of the discussion was that CMOs must find out what CEOs want from them before they can build measures that prove they are delivering it. Obvious as this seems, it is apparently news to many marketers. Sadly, the panel had a magic bullet for the most fundamental problems of marketing measurement: that it’s often not possible to measure the actual impact of any particular marketing program, and that sophisticated analytics are too expensive for many marketers to afford. The best advice along those lines boiled down to “get over it” (delivered, of course, much more politely): accept the limitations and do the best you can with the resources at hand.
So, if the attendees voted with their feet to avoid the topic of marketing performance measurement, where did they head instead? I’d say the subject that most engaged them was social networks and how these can be harnessed for marketing purposes. Ironically, that discussion was much more about consumer marketing than business-to-business, although a few panelists did mention using social networks for business contacts (e.g. LinkedIn) and for business-oriented communities. The assembled experts did offer concrete suggestions for taking advantage of social networks, including viral campaigns, “free” market research, building brand visibility, creating inventory for online advertising, and creating specialized communities. They proposed a few new metrics, such as the number of conversations involving a product and the number of exposures to a viral message. But I didn’t sense much connection between the interest in social networks and any desire for marketers to be more analytical. Instead, I think the interest was driven by something more basic—an intuition that social networks present a new way to reach people in a world where finding an engaged audience is increasingly difficult. For now, the challenge is understanding how people behave in this new medium and how you can manage that behavior in useful ways. The metrics will come later.
Anyway, it was a very fun and stimulating two days. We now return to my regularly scheduled reality, which is already in progress.
Personally I found this anything but surprising. All the good marketers I’ve ever known have been disciplined, strategic thinkers. Apparently, this is not always the case in the technology industry. Many in this audience seemed to accept the common stereotype of marketers as too often focused on creativity rather than business value. And, despite the prominent exception of Advani’s presentation, there seemed to be considerable residual skepticism of the value provided by brand marketing in particular.
The group did seem heartened at the notion, repeated several times, that a new generation of analytically-minded marketers is on the rise. Yet I have to wonder: the worst attended session I saw was an excellent panel on marketing performance measurement. This featured Alex Eldemir of MarketingNPV, Stephen DiMarco of Compete, Inc., Laura Patterson of VisionEdge Marketing, and Michael Emerson of Aprimo. The gist of the discussion was that CMOs must find out what CEOs want from them before they can build measures that prove they are delivering it. Obvious as this seems, it is apparently news to many marketers. Sadly, the panel had a magic bullet for the most fundamental problems of marketing measurement: that it’s often not possible to measure the actual impact of any particular marketing program, and that sophisticated analytics are too expensive for many marketers to afford. The best advice along those lines boiled down to “get over it” (delivered, of course, much more politely): accept the limitations and do the best you can with the resources at hand.
So, if the attendees voted with their feet to avoid the topic of marketing performance measurement, where did they head instead? I’d say the subject that most engaged them was social networks and how these can be harnessed for marketing purposes. Ironically, that discussion was much more about consumer marketing than business-to-business, although a few panelists did mention using social networks for business contacts (e.g. LinkedIn) and for business-oriented communities. The assembled experts did offer concrete suggestions for taking advantage of social networks, including viral campaigns, “free” market research, building brand visibility, creating inventory for online advertising, and creating specialized communities. They proposed a few new metrics, such as the number of conversations involving a product and the number of exposures to a viral message. But I didn’t sense much connection between the interest in social networks and any desire for marketers to be more analytical. Instead, I think the interest was driven by something more basic—an intuition that social networks present a new way to reach people in a world where finding an engaged audience is increasingly difficult. For now, the challenge is understanding how people behave in this new medium and how you can manage that behavior in useful ways. The metrics will come later.
Anyway, it was a very fun and stimulating two days. We now return to my regularly scheduled reality, which is already in progress.
Thursday, January 31, 2008
QlikView Scripts Are Powerful, Not Sexy
I spent some time recently delving into QlikView’s automation functions, which allow users to write macros to control various activities. These are an important and powerful part of QlikView, since they let it function as a real business application rather than a passive reporting system. But what the experience really did was clarify why QlikView is so much easier to use than traditional software.
Specifically, it highlighted the difference between QlikView’s own scripting language and the VBScript used to write QlikView macros.
I was going to label QlikView scripting as a “procedural” language and contrast it with VBScript as an “object-oriented” language, but a quick bit of Wikipedia research suggests those may not be quite the right labels. Still, whatever the nomenclature, the difference is clear when you look at the simple task of assigning a value to a variable. With QlikView scripts, I use a statement like:
Set Variable1 = ‘123’;
With VBScript using the QlikView API, I need something like:
set v = ActiveDocument.GetVariable("Variable1")
v.SetContent "123",true
That the first option is considerably easier may not be an especially brilliant insight. But the implications are significant, because they mean vastly less training is needed to write QlikView scripts than to write similar programs in a language like VBScript, let alone Visual Basic itself. This in turn means that vastly less technical people can do useful things in QlikView than with other tools. And that gets back to the core advantage I’ve associated with QlikView previously: that it lets non-IT people like business analysts do things that normally require IT assistance. The benefit isn’t simply that the business analysts are happier or that IT gets a reduced workload. It's that the entire development cycle is accelerated because analysts can develop and refine applications for themselves. Otherwise, they'd be writing specifications, handing these to IT, waiting for IT to produce something, reviewing the results, and then repeating the cycle to make changes. This is why we can realistically say that QlikView cuts development time to hours or days instead of weeks or months.
Of course, any end-user tool cuts the development cycle. Excel reduces development time in exactly the same way. The difference lies in the power of QlikView scripts. They can do very complicated things, giving users the ability to create truly powerful systems. These capabilities include all kinds of file manipulation—loading data, manipulating it, splitting or merging files, comparing individual records, and saving the results.
The reason it’s taken me so long time to recognize that this is important is that database management is not built into today's standard programming languages. We’re simply become so used to the division between SQL queries and programs that the distinction feels normal. But reflecting on QlikView script brought me back to the old days of FoxPro and dBase database languages, which did combine database management with procedural coding. They were tremendously useful tools. Indeed, I still use FoxPro for certain tasks. (And not that crazy new-fangled Visual FoxPro, either. It’s especially good after a brisk ride on the motor-way in my Model T. You got a problem with that, sonny?)
Come to think of it FoxPro and dBase played a similar role in their day to what QlikView offers now: bringing hugely expanded data management power to the desktops of lightly trained users. Their fate was essentially to be overwhelmed by Microsoft Access and SQL Server, which made reasonably priced SQL databases available to end-users and data centers. Although I don’t think QlikView is threatened from that direction, the analogy is worth considering.
Back to my main point, which is that QlikView scripts are both powerful and easy to use. I think they’re an underreported part of the QlikView story, which tends to be dominated by the sexy technology of the in-memory database and the pretty graphics of QlikView reports. Compared with those, scripting seems pedestrian and probably a bit scary to the non-IT users whom I consider QlikView’s core market. I know I myself was put off when I first realized how dependent QlikView was on scripts, because I thought it meant only serious technicians could take advantage of the system. Now that I see how much easier the scripts are than today’s standard programming languages, I consider them a major QlikView advantage.
(Standard disclaimer: although my firm is a reseller for QlikView, opinions expressed in this blog are my own.)
Specifically, it highlighted the difference between QlikView’s own scripting language and the VBScript used to write QlikView macros.
I was going to label QlikView scripting as a “procedural” language and contrast it with VBScript as an “object-oriented” language, but a quick bit of Wikipedia research suggests those may not be quite the right labels. Still, whatever the nomenclature, the difference is clear when you look at the simple task of assigning a value to a variable. With QlikView scripts, I use a statement like:
Set Variable1 = ‘123’;
With VBScript using the QlikView API, I need something like:
set v = ActiveDocument.GetVariable("Variable1")
v.SetContent "123",true
That the first option is considerably easier may not be an especially brilliant insight. But the implications are significant, because they mean vastly less training is needed to write QlikView scripts than to write similar programs in a language like VBScript, let alone Visual Basic itself. This in turn means that vastly less technical people can do useful things in QlikView than with other tools. And that gets back to the core advantage I’ve associated with QlikView previously: that it lets non-IT people like business analysts do things that normally require IT assistance. The benefit isn’t simply that the business analysts are happier or that IT gets a reduced workload. It's that the entire development cycle is accelerated because analysts can develop and refine applications for themselves. Otherwise, they'd be writing specifications, handing these to IT, waiting for IT to produce something, reviewing the results, and then repeating the cycle to make changes. This is why we can realistically say that QlikView cuts development time to hours or days instead of weeks or months.
Of course, any end-user tool cuts the development cycle. Excel reduces development time in exactly the same way. The difference lies in the power of QlikView scripts. They can do very complicated things, giving users the ability to create truly powerful systems. These capabilities include all kinds of file manipulation—loading data, manipulating it, splitting or merging files, comparing individual records, and saving the results.
The reason it’s taken me so long time to recognize that this is important is that database management is not built into today's standard programming languages. We’re simply become so used to the division between SQL queries and programs that the distinction feels normal. But reflecting on QlikView script brought me back to the old days of FoxPro and dBase database languages, which did combine database management with procedural coding. They were tremendously useful tools. Indeed, I still use FoxPro for certain tasks. (And not that crazy new-fangled Visual FoxPro, either. It’s especially good after a brisk ride on the motor-way in my Model T. You got a problem with that, sonny?)
Come to think of it FoxPro and dBase played a similar role in their day to what QlikView offers now: bringing hugely expanded data management power to the desktops of lightly trained users. Their fate was essentially to be overwhelmed by Microsoft Access and SQL Server, which made reasonably priced SQL databases available to end-users and data centers. Although I don’t think QlikView is threatened from that direction, the analogy is worth considering.
Back to my main point, which is that QlikView scripts are both powerful and easy to use. I think they’re an underreported part of the QlikView story, which tends to be dominated by the sexy technology of the in-memory database and the pretty graphics of QlikView reports. Compared with those, scripting seems pedestrian and probably a bit scary to the non-IT users whom I consider QlikView’s core market. I know I myself was put off when I first realized how dependent QlikView was on scripts, because I thought it meant only serious technicians could take advantage of the system. Now that I see how much easier the scripts are than today’s standard programming languages, I consider them a major QlikView advantage.
(Standard disclaimer: although my firm is a reseller for QlikView, opinions expressed in this blog are my own.)
Friday, January 25, 2008
Alterian Branches Out
It was Alterian's turn this week in my continuing tour of marketing automation vendors. As I’ve mentioned before, Alterian has pursued a relatively quiet strategy of working through partners—largely marketing services providers (MSPs)—instead of trying to sell their software directly to corporate marketing departments. This makes great sense because their proprietary database engine, which uses very powerful columnar indexes, is a tough sell to corporate IT groups who prefer more traditional technology. Service agencies are more willing to discard such technology to gain the operating cost and performance advantages that Alterian can provide. This strategy has been a major success: the company, which is publicly held, has been growing revenue at better than 30% per year and now claims more than 70 partners with more than 400 clients among them. These include 10 of the top 12 MSPs in the U.S. and 12 of the top 15 in the U.K.
Of course, this success poses its own challenge: how do you continue to grow when you’ve sold to nearly all of your largest target customers? One answer is you sell more to those customers, which means expanding the scope of the product. In Alterian’s situation, it also probably means getting the MSPs to use it for more of their own customers.
Alterian has indeed been expanding product scope. Over the past two years it has moved from being primarily a data analysis and campaign management tool to competing as a full-scope enterprise marketing system. Specifically, it added high volume email generation through its May 2006 acquisition of Dynamics Direct, and added marketing resource management through the acquisition of Nvigorate in September of that year. It says those products are now fully integrated with its core system, working directly with the Alterian database engine. The company also purchased contact optimization technology in April 2007, and has since integrated that as well.
The combination of marketing resource management (planning, project management and content management) with campaign execution is pretty much the definition of an enterprise marketing system, so Alterian can legitimately present itself as part of that market.
The pressure that marketing automation vendors feel to expand in this manner is pretty much irresistible, as I’ve written many times before. In Alterian’s case it is a bit riskier than usual because the added capabilities don’t particularly benefit from the power of its database engine. (Or at least I don’t see many benefits: Alterian may disagree.) This means having a broader set of features actually dilutes the company’s unique competitive advantage. But apparently that is a price they are willing to pay for growth. In any case, Alterian suffers no particular disadvantage in offering these services—how well it does them is largely unrelated to its database.
Alterian’s other avenue for expansion is to add new partners outside of its traditional base. The company is moving in that direction too, looking particularly at advertising agencies and systems integrators. These are two quite different groups. Ad agencies are a lot like marketing services providers in their focus on cost, although (with some exceptions) they have fewer technical resources in-house. Alterian is addressing this by providing hosting services when the agencies ask for them. System integrators, on the other hand, are primarily technology companies. The attraction of Alterian for them is they can reduce the technology cost of the solutions they deliver to their clients, thereby either reducing the total cost or allowing them to bill more for other, more profitable services. But systems integrators, like in-house IT departments, are not always terribly price-conscious and are very concerned about the number of technologies they must support. It will be interesting to see how many systems integrators find Alterian appealing.
Mapped against my five major marketing automation capabilities of planning, project management, content management, execution and analytics, Alterian provides fairly complete coverage. In addition to the acquisitions already mentioned, it has expanded its reporting and analytics, which were already respectable and benefit greatly from its database engine. It still relies on alliances (with SPSS and KXEN) for predictive modeling and other advanced analysis, but that’s pretty common even among the enterprise marketing heavyweights. Similarly, it relies on integration with Omniture for Web analytics. Alterian can embed Omniture tags in outbound emails and landing pages, which lets Omniture report on email response at both campaign and individual levels.
Alterian also lacks real-time interaction management, in the sense of providing recommendations to a call center agent or Web site during a conversation with a customer. This is a hot growth area among enterprise marketing vendors, so it may be something the company needs to address. It does have some real-time or at least near-real-time capabilities, which it uses to drive email responses, RSS, and mobile phone messages. It may leverage these to move into this area over time.
If there’s one major issue with Alterian today, it’s that the product still relies on a traditional client/server architecture. Until recently, Web access often appeared on company wish lists, but wasn’t actually important because marketing automation systems were primarily used by a small number of specialists. If anything, remote access was more important to Alterian than other vendors because its partners needed to give their own clients ways to use the system. Alterian met this requirement by offering browser access through a Citrix connection. (Citrix allows a user to work on a machine in a different location; so, essentially, the agency’s clients would log into a machine that was physically part of the MSP’s in-house network.)
What changes all this is the addition of marketing resource management. Now, the software must serve large numbers of in-house users for budgeting, content management, project updates, and reporting. To meet this need, true Web access is required. The ystems that Alterian acquired for email (Dynamics Direct) and marketing resource management (Nvigorate) already have this capability, as might be expected. But Alterian’s core technology still relies on traditional installed client software. The company is working to Web-enable its entire suite, a project that will take a year or two. This involves not only changing the interfaces, but revising the internal structures to provide a modern services-based approach.
Of course, this success poses its own challenge: how do you continue to grow when you’ve sold to nearly all of your largest target customers? One answer is you sell more to those customers, which means expanding the scope of the product. In Alterian’s situation, it also probably means getting the MSPs to use it for more of their own customers.
Alterian has indeed been expanding product scope. Over the past two years it has moved from being primarily a data analysis and campaign management tool to competing as a full-scope enterprise marketing system. Specifically, it added high volume email generation through its May 2006 acquisition of Dynamics Direct, and added marketing resource management through the acquisition of Nvigorate in September of that year. It says those products are now fully integrated with its core system, working directly with the Alterian database engine. The company also purchased contact optimization technology in April 2007, and has since integrated that as well.
The combination of marketing resource management (planning, project management and content management) with campaign execution is pretty much the definition of an enterprise marketing system, so Alterian can legitimately present itself as part of that market.
The pressure that marketing automation vendors feel to expand in this manner is pretty much irresistible, as I’ve written many times before. In Alterian’s case it is a bit riskier than usual because the added capabilities don’t particularly benefit from the power of its database engine. (Or at least I don’t see many benefits: Alterian may disagree.) This means having a broader set of features actually dilutes the company’s unique competitive advantage. But apparently that is a price they are willing to pay for growth. In any case, Alterian suffers no particular disadvantage in offering these services—how well it does them is largely unrelated to its database.
Alterian’s other avenue for expansion is to add new partners outside of its traditional base. The company is moving in that direction too, looking particularly at advertising agencies and systems integrators. These are two quite different groups. Ad agencies are a lot like marketing services providers in their focus on cost, although (with some exceptions) they have fewer technical resources in-house. Alterian is addressing this by providing hosting services when the agencies ask for them. System integrators, on the other hand, are primarily technology companies. The attraction of Alterian for them is they can reduce the technology cost of the solutions they deliver to their clients, thereby either reducing the total cost or allowing them to bill more for other, more profitable services. But systems integrators, like in-house IT departments, are not always terribly price-conscious and are very concerned about the number of technologies they must support. It will be interesting to see how many systems integrators find Alterian appealing.
Mapped against my five major marketing automation capabilities of planning, project management, content management, execution and analytics, Alterian provides fairly complete coverage. In addition to the acquisitions already mentioned, it has expanded its reporting and analytics, which were already respectable and benefit greatly from its database engine. It still relies on alliances (with SPSS and KXEN) for predictive modeling and other advanced analysis, but that’s pretty common even among the enterprise marketing heavyweights. Similarly, it relies on integration with Omniture for Web analytics. Alterian can embed Omniture tags in outbound emails and landing pages, which lets Omniture report on email response at both campaign and individual levels.
Alterian also lacks real-time interaction management, in the sense of providing recommendations to a call center agent or Web site during a conversation with a customer. This is a hot growth area among enterprise marketing vendors, so it may be something the company needs to address. It does have some real-time or at least near-real-time capabilities, which it uses to drive email responses, RSS, and mobile phone messages. It may leverage these to move into this area over time.
If there’s one major issue with Alterian today, it’s that the product still relies on a traditional client/server architecture. Until recently, Web access often appeared on company wish lists, but wasn’t actually important because marketing automation systems were primarily used by a small number of specialists. If anything, remote access was more important to Alterian than other vendors because its partners needed to give their own clients ways to use the system. Alterian met this requirement by offering browser access through a Citrix connection. (Citrix allows a user to work on a machine in a different location; so, essentially, the agency’s clients would log into a machine that was physically part of the MSP’s in-house network.)
What changes all this is the addition of marketing resource management. Now, the software must serve large numbers of in-house users for budgeting, content management, project updates, and reporting. To meet this need, true Web access is required. The ystems that Alterian acquired for email (Dynamics Direct) and marketing resource management (Nvigorate) already have this capability, as might be expected. But Alterian’s core technology still relies on traditional installed client software. The company is working to Web-enable its entire suite, a project that will take a year or two. This involves not only changing the interfaces, but revising the internal structures to provide a modern services-based approach.
Thursday, January 17, 2008
Aprimo 8.0 Puts a New Face on Campaign Management
Loyal readers will recall a series of posts before New Years providing updates on the major marketing automation vendors: SAS, Teradata, and Unica. I spoke Aprimo around the same time, but had some follow-up questions that were deferred due to the holidays. Now I have my answers, so now you get your post.
Aprimo, if you’re not familiar with them, is a bit different from the other marketing automation companies because its has always focused on marketing administration—that is, planning, budgeting, project management and marketing asset management. It has offered traditional campaign management as well, although with more of a business-to-business slant than its competitors. Over the past few years the company acquired additional technology from Doubleclick, picking up the SmartPath workflow system and Protagona Ensemble consumer-oriented campaign manager. Parts of these have since been incorporated into its product.
The company’s most recent major release is 8.0, which came out last November. This provided a raft of analytical enhancements, including real-time integration with SPSS, near-real-time integration with WebTrends Web analytics, a data mart generator to simplify data exports, embedded reports and dashboards, and rule-based contact optimization.
The other big change was a redesigned user interface. This uses a theme of “offer management” to unify planning and execution. In Aprimo’s terms, planning includes cell strategy, marketing asset management and finance, while execution includes offers, counts and performance measurement.
Campaigns, the traditional unit of marketing execution, still play an important role in the system Aprimo campaigns contain offers, cells and segmentations, which are all defined independently—that is, one cell can be used in several segmentations, one offer can be applied to several cells, and one cell can be linked to several offers.
This took some getting used to. I generally think of cells of subdivisions within a segmentation, but in Aprimo those subdivisions are called lists. A cell is basically a label for a set of offers. The same cell can be attached to different lists, even inside the same segmentation. The same offers are attached to each cell across all segmentations. This provides some consistency, but is limited since a cell may use only some of its offers with a particular list. (Offers themselves can be used with different treatments, such as a postcard, letter, or email.) Cells also have tracking codes used for reporting. These can remain consistent across different lists, although the user can change the code for a particular list if she needs to.
Complex as this may sound, its purpose was simplicity. The theory is each marketer works with certain offers, so their view can be restricted to those offers by letting them work with a handful of cells. This actually makes sense when you think about.
The 8.0 interface also includes a new segmentation designer. This uses the flow chart approach common to most modern campaign managers: users start with a customer universe and then apply icons to define steps such as splits, merges, deduplication, exclusions, scoring, and outputs. Version 8.0 adds new icons for response definition, contact optimization, and addition of lists from outside the main marketing database. The system can give counts for each node in the flow or for only some branches. It can also apply schedules to all or part of the flow.
The analytical enhancements are important but don’t require much description. One exception is contact optimization, a hot topic that means different things in different systems. Here, it is rule-based rather than statistical: that is, users specify how customer contacts will be allocated, rather than letting the system find the mathematically best combination of choices. Aprimo’s optimization starts with users assigning customers to multiple lists, across multiple segmentations if desired. Rules can then specify suppressions, priorities for different campaigns, priorities within campaigns, and limits on the maximum number of contacts per person. These contact limits can take into account previous promotion history. The system then produces a plan that shows how many people will be assigned to each campaign.
This type of optimization is certainly valuable, although it is not as sophisticated as optimization available in some other major marketing systems.
I’m giving a somewhat lopsided view of Aprimo by focusing on campaign management. Its greatest strength has always been in marketing administration, which is very powerful and extremely well integrated—something Aprimo’s competitors cannot always say. Anyone with serious needs in both marketing administration and campaign management should give Aprimo a good, close look.
Aprimo, if you’re not familiar with them, is a bit different from the other marketing automation companies because its has always focused on marketing administration—that is, planning, budgeting, project management and marketing asset management. It has offered traditional campaign management as well, although with more of a business-to-business slant than its competitors. Over the past few years the company acquired additional technology from Doubleclick, picking up the SmartPath workflow system and Protagona Ensemble consumer-oriented campaign manager. Parts of these have since been incorporated into its product.
The company’s most recent major release is 8.0, which came out last November. This provided a raft of analytical enhancements, including real-time integration with SPSS, near-real-time integration with WebTrends Web analytics, a data mart generator to simplify data exports, embedded reports and dashboards, and rule-based contact optimization.
The other big change was a redesigned user interface. This uses a theme of “offer management” to unify planning and execution. In Aprimo’s terms, planning includes cell strategy, marketing asset management and finance, while execution includes offers, counts and performance measurement.
Campaigns, the traditional unit of marketing execution, still play an important role in the system Aprimo campaigns contain offers, cells and segmentations, which are all defined independently—that is, one cell can be used in several segmentations, one offer can be applied to several cells, and one cell can be linked to several offers.
This took some getting used to. I generally think of cells of subdivisions within a segmentation, but in Aprimo those subdivisions are called lists. A cell is basically a label for a set of offers. The same cell can be attached to different lists, even inside the same segmentation. The same offers are attached to each cell across all segmentations. This provides some consistency, but is limited since a cell may use only some of its offers with a particular list. (Offers themselves can be used with different treatments, such as a postcard, letter, or email.) Cells also have tracking codes used for reporting. These can remain consistent across different lists, although the user can change the code for a particular list if she needs to.
Complex as this may sound, its purpose was simplicity. The theory is each marketer works with certain offers, so their view can be restricted to those offers by letting them work with a handful of cells. This actually makes sense when you think about.
The 8.0 interface also includes a new segmentation designer. This uses the flow chart approach common to most modern campaign managers: users start with a customer universe and then apply icons to define steps such as splits, merges, deduplication, exclusions, scoring, and outputs. Version 8.0 adds new icons for response definition, contact optimization, and addition of lists from outside the main marketing database. The system can give counts for each node in the flow or for only some branches. It can also apply schedules to all or part of the flow.
The analytical enhancements are important but don’t require much description. One exception is contact optimization, a hot topic that means different things in different systems. Here, it is rule-based rather than statistical: that is, users specify how customer contacts will be allocated, rather than letting the system find the mathematically best combination of choices. Aprimo’s optimization starts with users assigning customers to multiple lists, across multiple segmentations if desired. Rules can then specify suppressions, priorities for different campaigns, priorities within campaigns, and limits on the maximum number of contacts per person. These contact limits can take into account previous promotion history. The system then produces a plan that shows how many people will be assigned to each campaign.
This type of optimization is certainly valuable, although it is not as sophisticated as optimization available in some other major marketing systems.
I’m giving a somewhat lopsided view of Aprimo by focusing on campaign management. Its greatest strength has always been in marketing administration, which is very powerful and extremely well integrated—something Aprimo’s competitors cannot always say. Anyone with serious needs in both marketing administration and campaign management should give Aprimo a good, close look.
Thursday, January 10, 2008
One More Chart on QlikTech
Appearances to the contrary, I do have work to do. But in reflecting on yesterday's post, I did think of one more way to present the impact of QlikTech (or any other software) on an existing environment. This version shows the net change in percentage of answers provided by each user role for each activity type. It definitely shows which roles gain capacity and which have their workload reduced. What I particularly like here is that the detail by task is clearly visible based on the size and colors of segments within the stacked bars, while the combined change is equally visible in the total height of the bars themselves.
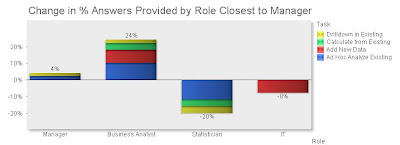
In case you were wondering, all these tables and charts have been generated in QlikView. I did the original data entry and some calculations in Excel, where they are simplest. But tables and charts are vastly easier in QlikView, which also has very nice export features to save them as images.

In case you were wondering, all these tables and charts have been generated in QlikView. I did the original data entry and some calculations in Excel, where they are simplest. But tables and charts are vastly easier in QlikView, which also has very nice export features to save them as images.
Wednesday, January 09, 2008
Visualizing the Value of QlikTech (and Any Others)
As anyone who knows me would have expected, I couldn't resist figuring out how to draw and post the chart I described last week to illustrate the benefits of QlikTech.
The mechanics are no big deal, but getting it to look right took some doing. I started with a simple version of the table I described in the earlier post, a matrix comparing business intelligence questions (tasks) vs. the roles of the people who can answer them.
Per Friday's post, I listed four roles: business managers, business analysts, statisticians, and IT specialists. The fundamental assumption is that each question will be answered by the person closest to business managers, who are the ultimate consumers. In other words, starting with the business manager, each person answers a question if she can, or passes it on to the next person on the list.
I defined five types of tasks, based on the technical resources needed to get an answer. These are:
- Read an Existing Report: no work is involved; business managers can answer all these questions themselves.
- Drilldown in Existing Report: this requires accessing data that has already been loaded into a business intelligence system and preppred for access. Business managers can do some of this for themselves, but most will be done by business analysts who are more fluent with the business intelligence product.
- Calculate from Existing Report: this requires copying data from an existing report and manipulating it in Excel or something more substantial. Business managers can do some of this, but more complex analyses are performed by business analysts or sometimes statisticians.
- Ad Hoc Analyze in Existing: this requires accessing data that has already been made available for analysis, but is not part of an existing reporting or business intelligence output. Usually this means it resides in a data warehouse or data mart. Business managers don't have the technical skills to get at this data. Some may be accessible to analysts, more will be available to statisticians, and a remainder will require help from IT.
- Add New Data: this requires adding data to the underlying business intelligence environment, such as putting a new source or field in a data warehouse. Statisticians can do some of this but most of the time it must be done by IT.
The table below shows the numbers I assigned to each part of this matrix. (Sorry the tables are so small. I haven't figured out how to make them bigger in Blogger. You can click on them for a full-screen view.) Per the preceding definitions, they numbers represent the percentage of questions of each type that can be answered by each sort of user. Each row adds to 100%.

I'm sure you recognize that these numbers are VERY scientific.
I then did a similar matrix representing a situation where QlikTech was available. Essentially, things move to the left, because less technically skilled users gain more capabilities. Specifically,
- There is no change for reading reports, since the managers could already do that for themselves.
- Pretty much any drilldown now becomes accessible to business managers or analysts, because QlikTech makes it so easy to add new drill paths.
- Calculations on existing data don't change for business managers, since they won't learn the finer points of QlikTech or even have the licenses needed to do really complicated things. But business analysts can do a lot more than with Excel. There are still some things that need a statistician's help.
- A little ad hoc analysis becomes possible for business managers, but business analysts gain a great deal of capability. Again, some work still needs a statistician.
- Adding new data now becomes possible in many cases for business analysts, since they can connect directly to data sources that would otherwise have needed IT support or preparation. Statisticians can also pick up some of the work. The rest remains with IT.
Here is the revised matrix:

So far so good. But now for the graph itself. Just creating a bar chart of the raw data didn't give the effect I wanted.
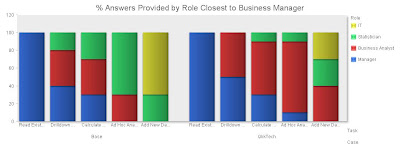
Yes, if you look closely, you can see that business managers and business analysts (blue and red bars) gain the most. But it definitely takes more concentration than I'd like.
What I really had in mind was a single set of four bars, one for each role, showing how much capability it gained when QlikTech was added. This took some thinking. I could add the scores for each role to get a total value. The change in that value is what I want to show, presumably as a stacked bar chart. But you can't see that when the value goes down. I ultimately decided that the height of the bar should represent the total capability of each role: after all, just because statisticians don't have to read reports for business managers, they still can do it for themselves. This meant adding the values for each row across, so each role accumulated the capabilities of less technical rows to their left. So, the base table now looked like:

The sum of each column now shows the total capability available to each role. A similar calculation and sum for the QlikTech case shows the capability after QlikTech is added. The Change between the two is each role's gain in capability.

Now we have what I wanted. Start with the base value and stack the change on top of it, and you see very clearly how the capabilities shift after adding QlikTech.
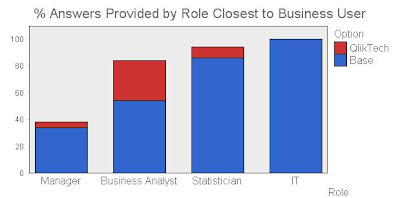
I did find one other approach that I may even like better. This is to plot the sums of the two cases for each group in a three-way bar chart, as below. I usually avoid such charts because they're so hard to read. But in this case it does show both the shift of capability to the left, and the change in workload for the individual roles. It's a little harder to read but perhaps the extra information is worth it.
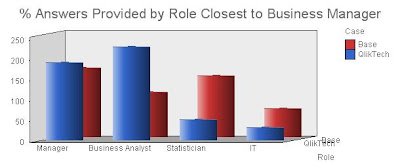
Obviously this approach to understanding software value can be applied to anything, not just QlikTech. I'd be interested to hear whether anybody else finds it useful.
Fred, this means you.
The mechanics are no big deal, but getting it to look right took some doing. I started with a simple version of the table I described in the earlier post, a matrix comparing business intelligence questions (tasks) vs. the roles of the people who can answer them.
Per Friday's post, I listed four roles: business managers, business analysts, statisticians, and IT specialists. The fundamental assumption is that each question will be answered by the person closest to business managers, who are the ultimate consumers. In other words, starting with the business manager, each person answers a question if she can, or passes it on to the next person on the list.
I defined five types of tasks, based on the technical resources needed to get an answer. These are:
- Read an Existing Report: no work is involved; business managers can answer all these questions themselves.
- Drilldown in Existing Report: this requires accessing data that has already been loaded into a business intelligence system and preppred for access. Business managers can do some of this for themselves, but most will be done by business analysts who are more fluent with the business intelligence product.
- Calculate from Existing Report: this requires copying data from an existing report and manipulating it in Excel or something more substantial. Business managers can do some of this, but more complex analyses are performed by business analysts or sometimes statisticians.
- Ad Hoc Analyze in Existing: this requires accessing data that has already been made available for analysis, but is not part of an existing reporting or business intelligence output. Usually this means it resides in a data warehouse or data mart. Business managers don't have the technical skills to get at this data. Some may be accessible to analysts, more will be available to statisticians, and a remainder will require help from IT.
- Add New Data: this requires adding data to the underlying business intelligence environment, such as putting a new source or field in a data warehouse. Statisticians can do some of this but most of the time it must be done by IT.
The table below shows the numbers I assigned to each part of this matrix. (Sorry the tables are so small. I haven't figured out how to make them bigger in Blogger. You can click on them for a full-screen view.) Per the preceding definitions, they numbers represent the percentage of questions of each type that can be answered by each sort of user. Each row adds to 100%.

I'm sure you recognize that these numbers are VERY scientific.
I then did a similar matrix representing a situation where QlikTech was available. Essentially, things move to the left, because less technically skilled users gain more capabilities. Specifically,
- There is no change for reading reports, since the managers could already do that for themselves.
- Pretty much any drilldown now becomes accessible to business managers or analysts, because QlikTech makes it so easy to add new drill paths.
- Calculations on existing data don't change for business managers, since they won't learn the finer points of QlikTech or even have the licenses needed to do really complicated things. But business analysts can do a lot more than with Excel. There are still some things that need a statistician's help.
- A little ad hoc analysis becomes possible for business managers, but business analysts gain a great deal of capability. Again, some work still needs a statistician.
- Adding new data now becomes possible in many cases for business analysts, since they can connect directly to data sources that would otherwise have needed IT support or preparation. Statisticians can also pick up some of the work. The rest remains with IT.
Here is the revised matrix:

So far so good. But now for the graph itself. Just creating a bar chart of the raw data didn't give the effect I wanted.

Yes, if you look closely, you can see that business managers and business analysts (blue and red bars) gain the most. But it definitely takes more concentration than I'd like.
What I really had in mind was a single set of four bars, one for each role, showing how much capability it gained when QlikTech was added. This took some thinking. I could add the scores for each role to get a total value. The change in that value is what I want to show, presumably as a stacked bar chart. But you can't see that when the value goes down. I ultimately decided that the height of the bar should represent the total capability of each role: after all, just because statisticians don't have to read reports for business managers, they still can do it for themselves. This meant adding the values for each row across, so each role accumulated the capabilities of less technical rows to their left. So, the base table now looked like:

The sum of each column now shows the total capability available to each role. A similar calculation and sum for the QlikTech case shows the capability after QlikTech is added. The Change between the two is each role's gain in capability.

Now we have what I wanted. Start with the base value and stack the change on top of it, and you see very clearly how the capabilities shift after adding QlikTech.

I did find one other approach that I may even like better. This is to plot the sums of the two cases for each group in a three-way bar chart, as below. I usually avoid such charts because they're so hard to read. But in this case it does show both the shift of capability to the left, and the change in workload for the individual roles. It's a little harder to read but perhaps the extra information is worth it.

Obviously this approach to understanding software value can be applied to anything, not just QlikTech. I'd be interested to hear whether anybody else finds it useful.
Fred, this means you.
Subscribe to:
Posts (Atom)