Wednesday, May 27, 2009

New White Paper and Eloqua Prospect Profiler

Eloqua yesterday announced Eloqua Prospect Profiler , which makes it easier for salespeople to review prospect behaviors that are captured by the demand generation system. In honor of the event, they sponsored a white paper by Yours Truly on the general topic of, um, why it’s important to make it easier for salespeople to review prospect behaviors that are captured by the demand generation system. The paper, Restoring the Balance: Why Marketing Holds the Key to Effective Selling in a Changed Business World, is available for free on the Raab Guide site and will eventually show up on the Eloqua site as well.

Despite its origins, the paper itself is quite generic and I think makes a valid argument: basically, that salespeople have less contact with prospects today because the prospects can gather so much information on their own. This makes it harder for salespeople to understand prospects and build relationships with them. The behavior data captured by marketing automation systems restores the balance by providing an alternate source of insights into prospect interests and intentions.

Replacing the relationship-building is more difficult, but demand generation systems can help somewhat by responding appropriately to prospect behaviors. This gives prospects a generally positive feeling towards the company even if no personal relationships are created. At a minimum, it keeps the company in the consideration set during the early stages of the buying cycle. Once the prospect has been assigned to an actual salesperson, the demand generation system can also send a stream of emails “signed” by the salesperson, building something of a one-to-one relationship. Obviously those emails must be appropriate, but this is what clever campaign design and good predictive modeling are about, per my last two posts.


Back to Eloqua Prospect Profiler. There’s nothing new about demand generation systems making prospect behavior available to sales people. Pretty much every major system on the market does this, and in roughly the same way: they pass activity headers over to the sales automation system, where they can be viewed as part of the normal interface, and let salespeople drill into details that are stored in the demand generation system itself. This may sound a bit awkward but it’s seamless from the user’s perspective, and moving all the details into the sales automation system isn’t practical.

Prospect Profiler’s claim to fame, so near as I can tell, is that it also presents summaries and trends of the prospect activity, per this very nice screenshot from Eloqua:


I don’t recall the other vendors doing that. The idea is to make it easier for the sales person to see patterns and then to drill into the details. This seems like a nice enhancement, and perhaps (I’m speculating here; Eloqua didn’t mention it) will be followed by additional of other marketing-gathered data with the salesperson’s interface. That would seem to be the general path that Eloqua and the rest of the industry are headed down, as part of the larger trend towards more closely intertwining marketing and sales activities.

If this isn't clear, think in terms of data from directories (D&B, Hoovers, OneSource), news feeds (Google Alerts, Lexis-Nexis, Reuters), social networks (Jigsaw, Linked-In), and social media (blogs, Facebook, Twitter). These are already assembled by various vendors, so all that’s needed is a relatively simple integration. The demand generation / marketing automation system is the obvious place to do this, rather than asking each sales person to do it for herself. The sales automation system could also be an option, but marketing already needs the data for its own purposes so it’s arguably a stronger contender.
Anther feature of Prospect Profiler is that salespeople can define their own rules for behavior-related alerts. Again, other demand generation systems also allow alerts, but I don't think they allow each salesperson to configure the rules for herself. It would be done by system administrators instead. But whether this is truly unique to Eloqua, I can't say.


Sunday, May 24, 2009

More on the Future of Demand Generation Systems

Summary: let's not forget that most companies are still not even doing simple demand generation. Systems for that might succeed even though advanced integration between sales and marketing is the long-run trend. And, my car hit a deer.

I hit a deer last Thursday while driving to Boston for the Sales 2.0 conference. I'm treating the four hour delay that followed as field research into customer relationship management, which ranged from great (the family-run auto shop that towed my car and took me in) to poor (the Enterprise car rental office that kept me waiting nearly two hours before admitting they didn’t have a vehicle available). It ended with the retired dad of the auto shop owners driving me into the next town to pick up a rental car there. The finishing touch was waving as we passed the local traffic cop, who had earlier stopped at the auto shop to chew the fat in true Mayberry RFD style. All told, my little visit to Plantsville (the actual town name) was straight from a grade B movie—city slicker makes an unplanned stop in a small town and learns about real life—except that I didn’t fall in love with a local shop girl.

The net result, beyond some new anecdotes, was that I missed much of the conference. My only extended conversation was with a sales manager who was just recognizing that cold calls were not the most efficient use of his time, and was quite excited to learn that many vendors can provide qualified lists and do the appointment setting for him. He was also starting to think that maybe the company Web site could play a role in attracting leads. In other words, he far behind the times. Yet he also appeared to be seasoned, competent and generally successful. In its own way, this conversation was as much an intrusion of the real world into my bubble as the stopover in Plantsville.

But then it was back to the bubble (so much more interesting than reality) with vendor meetings. Much of the conversation related to my blog post of the day before, which argued that self-adjusting statistical models will replace manually-generated business rules for alerts, lead scores, segmentation and message selection in demand generation systems. Discussing this idea let me to refine the presentation, which I now describe in terms of marketers catching up with changes in their role. That is, most marketers understand their job as generating leads and are just starting to implement systems to do this better. But their job today is actually to manage relationships deep into the buying process. Industry leaders have recently recognized this. The next step, which has barely begun, is for demand generation vendors to deliver solutions that support the new role. My specific argument is that self-adjusting models must replace rules because only models let the systems handle their expanded responsibilities and still be simple enough for marketers to actually use them. My broader argument is that self-adjusting models, rather than a variety of other new capabilities, will be the really important features for vendors to add.

My vendor discussions also touched on the other side of this coin, which is that demand generation systems to perform the original marketing tasks are quickly becoming commodities. Interestingly, I’ve spoken with more than one vendor who sees this as an opportunity, so long as they get to be the dominant commodity provider. Whether these vendors know how to make this happen is another question. I don't know myself, although I’m guessing the primary requirement (beyond a suitable product) is deep pockets for extensive marketing to grab share quickly.

Nor am I convinced that commoditization is a very good strategy, since even the dominant player may not make much money. But, with my little reality check still fresh in mind, I don’t want to underestimate the market for old-style demand generation systems. Perhaps a simple, low-priced system really can be a major success even though marketers will eventually need something more advanced. (Yes, the obvious strategy is to offer one product that can start simple and expand. But I’m very skeptical that this is actually possible.) It’s an interesting strategic puzzle. Fortunately for me, I don’t have to solve it. I just observe and report.

Wednesday, May 20, 2009

Prediction: Statistical Methods Will Replace Conventional Rules for Marketing Decisions

Summary: basic demand generation features are close to a commodity. Vendors who replace conventional decision rules with automated statistical methods may gain a key competitive advantage because the automated methods produce substantially and measurably better results.

One of the most popular posts ever on this blog is Low Cost Systems for Demand Generation, which listed several options that started at under $500 per month. But it seems that nearly every day brings yet another possibility to my attention. Some really frugal alternatives include Genoo starting at $199 per month; Net-Results starting at $79 per month; and Nurture starting at $495 per month. I haven’t looked closely at any of these but they all seem to promise the core demand generation capabilities of email, landing pages, automated nurturing, lead scoring, and sales system integration.

The question this raises in my mind is where the industry goes from here. Basic demand generation is on the verge of becoming a commodity if it isn’t one already. The more sophisticated vendors will of course continue to add features, but it’s not clear that most marketers will be interested in the additional capabilities or be able to handle the added complexity. Perhaps the key competitive battleground is the ability to add that complexity without making the systems harder to use. But even though there are certainly substantial differences in usability among today’s systems, it’s hard to see why everyone won’t eventually be able to do roughly equal jobs of simplifying their interfaces.

Another possibility is that vendors will compete on their ability to help marketers use their systems – that is, by providing marketing training, usage reviews, and professional services. In other marketing automation segments, including MCIF systems and campaign management for consumer marketers, the ability to provide such services was the single most important difference between winners and losers. The same applies to CRM systems – it was Siebel’s partnerships with big system integrators that ultimately let it pull away from the pack. I do think these services will be a key success factor in the demand generation market, but there’s a big difference: because demand generation systems are offered as on-demand services rather than on-premise software, the actual deployment is much simpler. This means independent consulting firms can more easily learn to work with multiple systems. Because it’s much harder for vendors to build a loyal, locked-in base of resellers, it’s easier for new players to duplicate the service infrastructure of established competitors.

This brings us back to features. Certainly there is a list of hot items right now: Webinar integration, digital asset management, dedicated IP addresses for outbound email, APIs to post data from external forms, integration with Google Adwords, providing contact names from external databases when a visiting company is recognized by its IP address, pulling data from social networks to flesh out a prospect’s profile, and interacting through social media in addition to traditional channels.

The question is which of these features will turn out to be really essential. The only one I personally see as important to a large number of marketers in the immediate future is the Webinar integration, because Webinars are widely popular and integration makes the marketer’s life significantly easier. Everything else on that list strikes me as either of interest to a relatively small fraction of marketers or as simple enough to add that it won’t be a competitive advantage.

So is there something else that could be really important? Well, I wouldn’t ask the question if I weren’t leading up to something.

My particular insight, if it is one, is that consensus has crystallized within the past month that marketing now remains dominant much deeper into the buying cycle, and that sales and marketing must work much more closely together as a result. The idea itself isn’t new, but I suddenly see it referenced everywhere I turn. Part of the reason may be that I’m paying more attention because I wrote a paper on the topic myself (see When Best Practices Go Bad: New Rules for Sales and Marketing Management) although I’m under no illusion that my paper was anything other than one voice among many. It’s simply one of those ideas whose time has come.

As I and others have written, the immediate implication of this change is that marketing systems should provide salespeople with more information about prospect behaviors – what Steve Woods of Eloqua elegantly calls “digital body language”. This gives the salespeople insights into customer interests, replacing to some extent the information that they previously gathered for themselves when dealing with prospects directly.

But those direct interactions also built a relationship between the salesperson and the prospect. Watching their behaviors doesn’t do that. To the extent that anything does build the early relationship today, it’s the automated nurturing programs and behavior-driven responses executed by marketing systems. I don’t really believe that even the cleverest marketing systems can really replace the trust built by a good salesperson, but at least the automated programs can educate prospects and leave a positive impression about the company’s responsiveness to their needs.

I haven’t seen much written about the burden that this change places on the marketing systems. We’re not talking about some simple drip marketing to keep leads warm and educate them a bit until they move closer to their purchase. Rather, marketing must come as close as possible to simulating the interactions between a prospect and a good salesperson to build an essential relationship. This means that the marketing system has to be really smart. And I think providing this sort of intelligence might be a major competitive battleground for the vendors.

That last sentence was a bit of a leap, so let me fill in the blanks. Today’s demand generation systems are largely rule-driven when it comes to selecting prospect treatments. Whether those rules are embedded in list definitions, campaign flows or dynamic content doesn’t matter. The problem is that rules are hard to build and remain unchanged until somebody writes a new one. They’re generally based on somebody’s best guess about how the world works and they tend to be fairly simple. As a result, rule-driven systems just can’t be very smart, in the sense of reacting appropriately to subtle clues or changes in behaviors.

The limits of rule-driven systems don’t matter when there isn’t much data to work with and there aren’t many choices to make. That was arguably the case in the past when lead management systems worked with only a small amount of data from a postal reply card or brief telephone survey. But today’s demand generation systems are dealing a flood of behavioral data related to emails and Web visits. Rules can’t deal optimally with that much information. In addition, the demand generation systems have many more decisions to make, since every personalized email and Web page involves many choices for information to display. No one can create enough rules to handle all the possibilities.

Nor is the challenge limited to rules for selecting messages. Demand generation systems also use rules to decide when to alert salespeople about prospect behaviors. Lead scoring formulas are essentially rules as well. In addition to the fact that these rules are all defined manually and pretty much arbitrarily (that is, based on users’ best judgments), there is little feedback to check whether they are effective.

All of this absolutely guarantees that demand generation systems will produce suboptimal results. That would be annoying under any circumstances, but if the demand generation system takes on the primary responsibility for early relationship building, it’s more than merely annoying. It could destroy your company.

There is an alternative. Marketing systems can deploy automated statistical techniques to select messages, issue alerts and send leads to sales. Consumer marketers have used such methods for years with proven success. In addition to dealing with many more options than rules can handle, such systems can automatically learn from past results to improve their accuracy and adjust to changes in behaviors. Nicer still, marketers and salespeople can actually observe the success or failure of the decisions by watching objective criteria such as return visits and close rates. This last point is critical because it means marketers have a way to actually compare the value of decisions made by different systems. This means that vendors can meaningfully compete to offer the best decision-making capabilities, and marketers can choose the system that does a better job. And, unlike a feature that appeals to just a small fraction of marketers, better decisions are important to everyone. A system that could show it made better decisions would therefore have a very major competitive advantage.

So far, everything I’ve written here is just my private little theory. I haven’t heard any vendor, pundit or client suggest anything similar. This could well mean that I’m wrong; after all, I do like fancy automated systems with their cool bells and whistles. But I think maybe I’m right. Demand generation systems are getting more and more complicated, and something is needed to radically simply them before they collapse into chaos. Given that the stakes are nothing less than the sales process itself, allowing this to happen is unthinkable.

Tuesday, May 12, 2009

Eloqua Adds Free Implementation Offering

On Monday, Eloqua announced a new free deployment service for its clients. This is part of a larger industry trend to offer free deployment. It follows last month’s free deployment offer from Eloqua reseller Pedowitz Group, which generated quite a bit of comment on this blog. The new service, called QuickStart, will also be delivered by Eloqua partners, giving them an opportunity to start a relationship that could lead to future paid business. Crafty.

Eloqua Senior Vice President Paul Teshima, who is in charge of post-sales support, said the new program includes system configuration, CRM data integration, setting up an email template, landing page, three-touch lead nurturing program and a lead scoring discussion. It is delivered remotely and can be completed in two days to two weeks, depending on how much time the client has available. Advance preparation involves filling out a survey and receiving (if not reading) simple documentation. Clients fill out a workbook during the sessions and are the consultant leaves behind a 90 day plan for future action.

Teshima said the new program was developed in response to customer requests for a fast way to get some immediate use from their systems. It is a subset of the company’s year-old SmartStart program, which take five days or longer but includes more extensive email set-up; data posting from an external Web form; deeper CRM integration including lead flow, activity-triggered sales alerts, lead assignment, and email opt-outs; creation of either a lead scoring or lead nurturing program; and several types of marketing assessments and planning. SmartStart involves on-site consulting and costs $3,000 to $8,000.

The difference in scope between QuickStart and SmartStart provides a useful reminder of the importance of digging into the details of vendor claims about deployment. The question isn’t whether it’s free or can be done in one day, but what’s included and how much your company must do in advance.

The reality is that a complete demand generation program is something you develop and expand over time. A good start is important but it’s only a start.

Another reality is that most companies need help with improving their programs. Teshima pointed to Eloqua's customer success managers, who meet with each client quarterly to review system usage and develop a plan for improvements. They are compensated solely on retention rates, so their focus is on making better use of existing components rather than selling new licenses.

Eloqua also has its professional services group and consulting partners to provide more hands-on assistance. Other vendors also provide such services, either with their own own staff or through partners.

My point is to recognize that you’ll very likely want to purchase such services to get the most value from your demand generation investment. If that sounds like bad news, I guess you don’t absolutely need to. And while you’re saving money on that, you can also change your car’s oil and cut your own hair to save money on mechanics and stylists.

Sarcasm aside, a few companies already have skills to deploy a demand generation system effectively, but most do not. The reason you pay money for these systems is because they’ll help you do a better job. Not investing in the training and consulting means you’ll get less value than you should. Of course, you still need to invest wisely, in the sense of getting the right training and consulting. And, yes, you can probably get some value even without outside help.

Training and consulting are ultimately business decisions about where you can spend money to get the greatest return on your investment. A small investment in using your system effectively is likely to be a wise choice.

Tuesday, May 05, 2009

Demand Generation Deployment Survey: Preparation Saves Two Months

Summary: My survey of demand generation deployments found that some companies deploy many features immediately, while others take two or three months to reach the same stage. A fast start depends on ample preparation. A white paper on the Raab Guide site explores the results in detail.

**************************************

I finished my detailed analysis of the demand generation deployment survey results yesterday and posted it to the resource library of the Raab Guide site. This turned out to be a major project (the analysis, not the posting) because I revisited the data from a company perspective. The analysis in my earlier blog posts looked at average deployment rates by feature, without relating those to particular companies.

As often happens, averages gave misleading results. For example, one of the original factoids that most impressed me was that 80% of features ever deployed are deployed by the second month. This seems to suggest that people deploy quickly and then are largely done. But analyzing data by company, I found a very wide divergence in behaviors: some companies deploy nearly all features immediately, while others start very slowly.

Specifically, I grouped the companies into four quartiles, ranked by the number of features they deployed during the first week. This figure itself varied hugely, from 0.6 features per company in the lowest quartile to 8.8 features/company in the highest. But what I found is the companies who start with very few features will add them steadily over time, while the ones who deploy many features immediately quickly reach the maximum. So, that average of 80% deployment by the second month really is a combination of rates ranging from 57% to 97% for the different quartiles.

table 10 [table numbers refer to tables in the paper]

% of final features deployed by time period (companies stay in original quartile over time)

quartile

first week

first month

second month

third month

later

1 (tortoise)

0.05

0.32

0.57

0.72

1.00

2

0.28

0.55

0.70

0.77

1.00

3

0.49

0.76

0.84

0.86

1.00

4 (hare)

0.68

0.93

0.97

0.97

1.00

average

0.39

0.66

0.80

0.84

1.00


In other words, we have a classic tortoise vs the hare race, with some fast starters and others moving slow but steady. Looking at the number of features per company rather than percentages, we see the tortoises (quartile 1) never quite catch up, but do greatly narrow the gap.

table 9

average features per company by quartile (companies stay in original quartile over time)

quartile

first week

first month

second month

third month

later

1 (tortoise)

0.6

3.4

6.1

7.7

10.7

2

3.0

6.0

7.7

8.3

10.9

3

5.6

8.7

9.7

9.9

11.5

4 (hare)

8.8

12.0

12.6

12.6

12.9

average

4.5

7.6

9.2

9.6

11.5


My fundamental interpretation is that the companies who deploy many features immediately have done their homework and are ready to go from day one, while those who start slowly did little advance preparation. The figures above suggest it takes the tortoises about three months to approach the initial deployment levels of the hares - so it seems this is the length of the delay from lack of preparation.

I actually tightened the analysis even more by looking separately at deployment rates for basic, advanced and optional features within each quartile. (Basic features are needed for simple email campaigns; advanced and optional features are more complex and less common. The paper describes the definitions in detail.) Looking just at the basic features, you'll see they're deployed sooner than average, and that even the tortoises finish implementing them by the second or third month. (You'll also note that, even among basic features, the tortoises never quite deploy as many as the hares.)

table E-1

cumulative features deployed by quartile (based on first period rank)

% of final features deployed by period

average features deployed

quartile

feature

category

first week

first month

second month

third month

later

1 (tortoise)

basic

0.10

0.53

0.85

0.93

1.00

4.4

2

basic

0.52

0.79

0.88

0.90

1.00

4.7

3

basic

0.71

0.88

0.92

0.92

1.00

4.8

4 (hare)

basic

0.84

0.98

1.00

1.00

1.00

5.0

avg

0.56

0.80

0.91

0.94

1.00

4.7


The paper draws a number of other conclusions from the data and makes some helpful if generic recommendations (select the right system, prepare in advance, plan for expansion, test and measure). That's all good stuff but far from world-changing. What's really interesting is the details themselves - go ahead and dig into the paper and see what you find.

Wednesday, April 29, 2009

New Webinars and White Paper

I have two Webinars and a newly published white paper you might find interesting:
  • Webinar Making the Right Start with Demand Generation, Thursday, April 30, 2:00 p.m. Eastern. This will discuss preparing for your new demand generation system, including requirements definition, vendor selection, and the initial deployment. I'll talk a bit more about results of the deployment survey. Sponsored by Marketo. Click here to register.

  • Webinar How to 'walk the walk' with the Sales 2.0 Approach to Aligning Sales & Marketing, Wednesday, May 13, 1:30 p.m. Eastern. This will be feature myself, Sales 2.0 guru Anneke Seley, and Genius.com CEO David Thompson in a discussion format. Sponsored by Genius.com. Click here to register.

  • White Paper When Best Practices Go Bad: New Rules for Sales and Marketing Management. Best practices that were valid just a few years ago are now obsolete. This paper shows why and offers some replacements. Also sponsored by Genius.com. Download here.

Demand Generation Implementation Survey: Half of Users Deploy Basic Features in One Week

Summary: a small survey of demand generation users shows that more than half deployed basic demand generation features within one week, and about 75% within one month. More complicated features take longer, but in general, 80% of the features ever deployed are in place by the end of two months. This suggests that marketers are quickly gaining value from their systems, but also highlights the need for continued training to be sure they take advantage of all system capabilities.

*********************

Yesterday’s post described the responders to my online survey on demand generation implementation. Today we get to the main event: what people actually do.

Table 1 shows the actual responses, with the items ordered by % used (that is, how many respondents ultimately deployed a given function).


table 1

How soon after starting implementation did you first do...
first done:

first week

first month

second month

third month

later

never

total

% used

outbound email campaign

22

8

5

1

0

0

36

1.00

campaign response reporting

12

15

3

2

4

0

36

1.00

lead transfer to CRM

18

5

8

0

2

2

35

0.94

CRM integration / synchronization

23

4

2

1

3

3

36

0.92

landing page

19

9

2

0

2

4

36

0.89

lead scoring

12

7

3

0

10

4

36

.89

multi-step lead nurturing campaign

8

10

7

2

5

4

36

0.89

Web site analytics

14

7

6

2

2

4

35

0.89

Webinar campaign

5

13

5

1

6

5

35

0.86

campaign ROI reporting

7

11

3

0

8

6

35

0.83

data cleansing process

10

7

1

3

7

8

36

0.78

pay per click campaign reporting

9

5

1

2

6

12

35

0.66

Web page survey

3

6

5

1

6

15

36

0.58

email survey

2

2

6

1

7

16

34

0.53

combined

164

109

57

16

68

83

497

0.83


Looking at the table, we see:

- virtually everyone (more than 90%) does outbound email, campaign reponse reporting, lead transfer to CRM, and CRM integration. No surprises there.

- Just slightly fewer (80-90%) do landing pages, lead scoring, multi-step lead nurturing, Web site analytics, Webinars and campaign ROI reporting. I’m a bit surprised to see Webinars ranking so highly, given that support for them is rather limited in many demand generation systems. But they’re certainly a popular marketing tool, so I guess people will run them through their demand generation system regardless. The high utilization of other relatively advanced features is impressive (lead scoring, lead nurturing and ROI reporting), although perhaps to be taken with a grain of salt.

- Other features are less widely employed (53-78%), including data cleansing, pay per click (PPC) campaign reporting, and Web and email surveys. The latter three make sense: it’s hard to get PPC costs into a demand generation system, so many people probably don’t bother. Surveys are simply not that common, bearing in mind that most data is gathered through forms on landing pages. On the other hand, the relatively low utilization of data cleansing is a bit scary because I strongly suspect nearly everyone needs it. This may reflect the fairly limited data cleansing tools in most demand generation products.

So far so good. But the main purpose of the survey was to understand when and how quickly the different functions get deployed, to get a more nuanced view of the implementation process – and, in particular, see what marketers can realistically expect to accomplish in the first week.

Table 2 addresses this by calculating the cumulative fraction of responders who had deployed each function by each milestone (one week after implementation, one month, two months, etc.). The calculation excludes people who never deploy a given function, since we’re trying to understand how quickly the people who use a function deploy it.


table 2

cumulative deployment rate (base: ever deployed)

cumulative %

first week

first month

second month

third month

later

% used

landing page

0.59

0.88

0.94

0.94

1.00

0.89

outbound email campaign

0.61

0.83

0.97

1.00

1.00

1.00

CRM integration / synchronization

0.70

0.82

0.88

0.91

1.00

0.92

campaign response reporting

0.33

0.75

0.83

0.89

1.00

1.00

lead transfer to CRM

0.55

0.70

0.94

0.94

1.00

0.94

Web site analytics

0.45

0.68

0.87

0.94

1.00

0.89

multi-step lead nurturing campaign

0.25

0.56

0.78

0.84

1.00

0.89

Webinar campaign

0.17

0.60

0.77

0.80

1.00

0.86

data cleansing process

0.36

0.61

0.64

0.75

1.00

0.78

pay per click campaign reporting

0.39

0.61

0.65

0.74

1.00

0.66

campaign ROI reporting

0.24

0.62

0.72

0.72

1.00

0.83

Web page survey

0.14

0.43

0.67

0.71

1.00

0.58

lead scoring

0.38

0.59

0.69

0.69

1.00

0.89

email survey

0.11

0.22

0.56

0.61

1.00

0.53

combined

0.40

0.66

0.80

0.84

1.00

0.83


I’ve arbitrarily chosen to highlight when each function exceeds 75% utilization. This shows the relative deployment speed and presents a very interesting pattern:

- the basic demand generation activities needed for a simple email campaign (outbound email, landing pages, CRM integration and response reporting) are almost fully deployed in the first month . In fact, about half the users deploy them in the first week.

- Lead transfer to CRM doesn’t quite make the one month cut-off, but it’s also deployed by half the people in the first week, and almost everyone by the second month. Clearly moving leads to sales to a core demand generation function. The somewhat slower deployment, if it’s anything more than noisy data, might reflect the added time needed to set up a lead transfer process in cooperation with sales. You’ll note that the preceding four items were totally under marketing’s control.

- Web site analytics shows a pattern like lead transfer: nearly half the people do it immediately, but then there is a lag until it reaches nearly 90% deployment in month two. This might also reflect the need for help from the an outside department (whoever runs the company Web site). It might also reflect relatively low urgency, since other Web analytics tools are often in place. But bear in mind that detailed activity tracking of individual Web site visitors (not provided by traditional Web analytics) requires the demand generation tracking code to be installed.

- Multi-step lead nurturing and Webinar campaigns are both fairly complex projects, so it makes sense that deployment of these builds slowly and steadily through the first few months. We can probably infer that most marketers start with something simpler and then add these as they become more proficient with the systems.

- Most of the remaining items (data cleansing, PPC reporting, Web and email surveys) are relatively low priority, as reflected in their % used scores, so relatively slow deployment makes sense. The two exceptions are campaign ROI reporting and lead scoring, which have high ultimate usage rates (83% and 89%) but take a long time to reach those levels. Both are relatively complicated and require cooperation from external departments: ROI reporting needs revenue from sales and approved formulas from finance; lead scoring needs coordination with sales management. I think it’s reasonable to conclude that the importance of these items pushes marketers to deploy them, but their complexity and the need for external cooperation slows the implementation.

Is there a trend in deployment speed over time? I did some analysis of results by implementation year, and the pace does seem to be picking up. But it's a tricky analysis since more recent implementations haven't had time to deploy the longer-lead functions. I'll revisit this if time permits and let you know if I find anything.

Table 3 is similar to table 2, except that the fractions are calculated including never-deployed cases. This gives a more realistic view of the actual pace of deployment for different features. The sequencing is pretty much the same as table 2, with the notable exceptions of lead scoring and campaign ROI ranking somewhat higher.

table 3

cumulative deployment rate (including never deployed)

cumulative %

first week

first month

second month

third month

later

never

outbound email campaign

0.61

0.83

0.97

1.00

1.00

-

landing page

0.53

0.78

0.83

0.83

0.89

0.11

CRM integration / synchronization

0.64

0.75

0.81

0.83

0.92

0.08

campaign response reporting

0.33

0.75

0.83

0.89

1.00

-

lead transfer to CRM

0.51

0.66

0.89

0.89

0.94

0.06

Web site analytics

0.40

0.60

0.77

0.83

0.89

0.11

multi-step lead nurturing campaign

0.22

0.50

0.69

0.75

0.89

0.11

lead scoring

0.33

0.53

0.61

0.61

0.89

0.14

Webinar campaign

0.14

0.51

0.66

0.69

0.86

0.11

campaign ROI reporting

0.20

0.51

0.60

0.60

0.83

0.17

data cleansing process

0.28

0.47

0.50

0.58

0.78

0.22

pay per click campaign reporting

0.26

0.40

0.43

0.49

0.66

0.34

Web page survey

0.08

0.25

0.39

0.42

0.58

0.42

email survey

0.06

0.12

0.29

0.32

0.53

0.47

0.33

0.55

0.66

0.70

0.83

0.17


Summary

Pulling back from these details, what I find really impressive is how quickly in general the features are deployed: 40% of the features ever deployed are deployed in the first week; two-thirds are deployed in the first month, and 80% by the second month. An optimist might argue that this shows marketers are quickly gaining value from their systems. A pessimist could say this shows that marketers learn a few things quickly and then stop.

The slow-but-steady deployment of complex processes like ROI reporting and lead scoring suggests that neither view is quite accurate, since marketers do add some features over time. It’s also true that this survey didn’t capture some of the more esoteric demand generation applications that marketers might add later. So it does seem there is at least some continued development after the initial implementation.

Circling back to the original question of how much marketers can expect to accomplish during the first week, the short answer is: quite a bit, actually. But it still takes a couple of months to get fully up to speed, and there is certainly a need for continued training to ensure you get the full value of any demand generation system. The job is far from done the day the implementation team walks out the door.

Tuesday, April 28, 2009

Demand Generation Implementation Survey - Background Results

I've been having a dandy time analyzing the results of my Demand Generation Implementation Survey. Responses are still coming in but I thought I'd at least post some preliminary results to whet your appetite. Hopefully I'll be able to post a more substantive analysis tonight or tomorrow.

As of April 29, I've received 40 responses, of which I've discarded two as incomplete and two because they related to vendors I considered irrelevant (Zoho and Ad Giants PitchRocket). Obviously any survey based on 36 net responses (and self-selected at that) has little statistical value, but I still think the broad results are extremely interesting.

The survey was promoted on this blog and the Raab Guide site, but primarily via posts on Twitter. (Thanks to the many people who 'retweeted' the request). This introduces yet another source of sample bias. One measure of this is the distribution of vendors reported by the respondents, which clearly doesn't reflect the installed base of the industry. This distribution actually pleases me, since it means we have results from users of many different systems. (Obviously, however, the quantities are too small and sample bias too significant to break out results by vendor.)


nbr responses vendor
8Marketo
6Eloqua
3Genius.com
3LoopFuse
3Pardot
2Market2Lead
2

Treehouse Interactive

1eTrigue
1Vtrenz (Silverpop)
7No Response
36


Another intriguing bit of contextual information is the deployment date of the systems. Two respondents actually reported future dates -- I'd guess those were typos but, since responses were anonymous, I couldn't ask. There was actually another dated 6/01/2208, which I treated as 2008.

I was also curious to see the six responses for implementations during 3/09 and 4/09; obviously, these companies haven't gotten past their first or second month. Most of the answers for those entries reported features deployed within the first two months, or made the reasonable selection of 'later', so they could quite well be accurate. One repondent reported deployment on 4/24/09 (i.e., last week) but showed several features as deployed in month three. I assume represents their plans rather than reality. Fair enough.

In any case, the ten deployments in the first four months of 2009 (or 12 if you count the two future dates) and 12 in 2008 highlights the newness and fast growth of the demand generation industry. There were just five earlier deployments, including one for 1990, which is almost surely an error.


nbr responses

deployment date

1

10/09

1

8/09

3

4/09

3

3/09

1

2/09

3

1/09

12

2008

2

2007

2

2006

1

2005

1

1990

6

No Response

36


One final bit of more data, this more substantive: I asked how well their experience with deployment and their systems as a whole had met their expectations. Results strike me as extremely positive -- about two-thirds rated both experiences as better than expected, with just a bit more satisfaction with the systems than the implementation. Only a couple of responders felt things were worse than expected. Again, we have to consider sample bias. But even so, this seems to be a pretty happy set of campers.

I actually looked to see if there was any relationship between deployment year and satisfaction, and it newer customers may be a bit happier. But the numbers are very small, recency may also introduce some bias, and in any event even the earlier customers are highly satisfied. So I don't consider this more than a hint of what might be the case.


How would you rate your experience with...
%

better than expected

about as expected

worse than expected

total

system implementation

0.64

0.33

0.03

1.00

the system itself

0.67

0.28

0.06

1.00


How would you rate your experience with...
nbr responses

better than expected

about as expected

worse than expected

total

system implementation

23

12

1

36

the system itself

24

10

2

36

Tuesday, April 21, 2009

Demand Generation Implementation -- Take My Survey, Please!

Update - 4/23/09: I have some preliminary results, but would still like more responses. Click here to take survey. One result of interest: how quickly people deploy the features they eventually use. I had expected people to start slow and add more features over time. Not so much. It seems that by the end of the first month, people have already used 2/3 of the features they will ever use. Interesting. Here is the cumulative percentage of total features deployed based on when they were first deployed:

time since system deployment first weekfirst month second month third month later

cumulative % of used features

38%65%81%86%100%


The recent discussion triggered by my post Pedowitz Group Offers Free Support for New Eloqua Clients raises an important question: Just how much can marketers realistically expect to accomplish during the initial stages of a demand generation system deployment?

The obvious answer is “it depends”, but that just begs the question, “Depends on what?” My own take is that the main factor is how well the marketers know what they want to do – that is, do they understand their data, know what marketing campaigns they want to set up, have the materials in hand and process flows defined, know what their scoring rules should be, etc.

In theory, those could be defined even before a marketing automation system is selected. You actually need a pretty good idea of the answers to select the right system. One might also think that most companies would already have these processes in place, even if they’re not formally defined. Yet my impression from industry vendors and consultants is that most deployments start with a fairly extended planning stage where companies either document their existing campaigns and processes or, more likely, define a large number of new ones.

This makes sense to a certain degree, since a demand generation system allows vastly more activity, specified in more detail, than was possible without one. A new system also presents an opportunity to revisit and update existing practices rather than simply reproducing them.

In any event, I’m curious about people’s actual experiences. I’ve created a little poll using SurveyMonkey – if you’ve implemented a demand generation system, please click below to fill it out. Of course, I’ll report on results when I have some. Thanks!

Click here to take survey

Thursday, April 16, 2009

Lyzasoft: Independence for Analysts and Maybe Some Light on Shadow IT

Long-time readers of this blog know that I have a deep fondness for QlikView as a tool that lets business analysts do work that would otherwise require IT support. QlikView has a very fast, scalable database and excellent tools to create reports and graphs. But quite a few other systems offer at least one of these.*

What really sets QlikView apart is its scripting language, which lets analysts build processing streams to combine and transform multiple data sources. Although QlikView is far from comparable with enterprise-class data integration tools like Informatica, its scripts allow sophisticated data preparation that is vastly too complex to repeat regularly in Excel. (See my post What Makes QlikTech So Good for more on this.)

Lyzasoft Lyza is the first product I’ve seen that might give QlikView a serious run for its money. Lyza doesn’t have scripts, but users can achieve similar goals by building step-by-step process flows to merge and transform multiple data sources. The flows support different kinds of joins and Excel-style formulas, including if statements and comparisons to adjacent rows. This gives Lyza enough power to do most of the manipulations an analyst would want in cleaning and extending a data set.

Lyza also has the unique and important advantage of letting users view the actual data at every step in the flow, the way they’d see rows on a spreadsheet. This makes it vastly easier to build a flow that does what you want. The flows can also produce reports, including tables and different kinds of graphs, which would typically be the final result of an analysis project.

All of that is quite impressive and makes for a beautiful demonstration. But plenty of systems can do cool things on small volumes of data – basically, they throw the data into memory and go nuts. Everything about Lyza, from its cartoonish logo to its desktop-only deployment to the online store selling at a sub-$1,000 price point, led me to expect the same. I figured this would be another nice tool for little data sets – which to me means 50,000 to 100,000 rows – and nothing more.

But it seems that’s not the case. Lyzasoft CEO Scott Davis tells me the system regularly runs data sets with tens of millions of rows and the biggest he’s used is 591 million rows and around 7.5-8 GB.

A good part of the trick is that Lyza is NOT an in-memory database. This means it’s not bound by the workstation’s memory limits. Instead, Lyza uses a columnar structure with indexes on non-numeric fields. This lets it read required data from the disk very quickly. Davis also said that in practice most users either summarize or sample very large data sets early in their data flows to get down to more manageable volumes.

Summarizing the data seems a lot like cheating when you’re talking about scalability, so that didn’t leave me very convinced. But you can download a free 30 day trial of Lyza, which let me test it myself.

Bottom line: my embarrassingly ancient desktop (2.8 GHz CPU, 2 GB RAM, Windows XP) loaded a 400 MB CSV file with about 430,000 rows in just over 6 minutes. That’s somewhat painful, but it does suggest you could load 4 GB in an hour – a practical if not exactly desirable period. The real issue is that each subsequent step could take similar amounts of time: copying my 400 MB set to a second step took a little over 2 minutes and, more worrisome, subsequent filters took the same 2 minutes even though they reduced the record count to 85,000 then 7,000 then 50. This means a complete processing flow on a large data set could run for hours.

Still, a typical real-world scenario would be to do development work on small samples, and then only run a really big flow once you knew you had it right. So even the load time for subsequent steps is not necessarily a show-stopper.

Better news is that rerunning an existing filter with slightly different criteria took just a few seconds, and even rerunning the existing flow from the start was much faster than the first time through. Users can also rerun all steps after a given point in the flow. This works because Lyza saves the intermediate data sets. It means that analysts can efficiently explore changes or extend an existing project without waiting for the entire flow to re-execute. It’s not as nice as running everything on a lightning-fast data server, but most analysts would find it gives them all the power they need.

As a point of comparison, loading that same 400 MB CSV file took almost 11 minutes with QlikView. I had forgotten how slowly QlikView loads text files, particularly on my limited CPU. On the other hand, loading a 100 MB Excel spreadsheet took about 90 seconds for Lyza vs. 13 seconds in QlikView. QlikView also compressed the 400 MB to 22 MB on disk and about 50 MB in memory, whereas Lyza more than doubled data to 960 MB of disk, due mostly to indexes. Memory consumption in Lyza rose only about 10 MB.

Of course, compression ratios for both QlikView and Lyza depend greatly on the nature of the data. This particular set had lots of blanks and Y/N fields. The result was much more compression than I usually see in QlikView and, I suspect, more expansion than usual in Lyza. In general, Lyza seems to make little use of data compression, which is usually a key advantage of columnar databases. Although this seems like a problem today, it also means there's an obvious opportunity for improvement as the system finds itself dealing with larger data sets.

What I think this boils down to is that Lyza can effectively handle multi-gigabyte data volumes on a desktop system. The only reason I’m not being more definite is I did see a lot of pauses, most accompanied by 100% CPU utilization, and occasional spikes in memory usage that I could only resolve by closing the software and, once or twice, by rebooting. This happened when I was working with small files as well as the large ones. It might have been the auto-save function, my old hardware, crowded disk drives, or Windows XP. On the other hand, Lyza is a young product (released September 2008) with only a dozen or so clients, so bugs would not be surprising. I'm certainly not ready to say Lyza doesn't have them.

Tracking down bugs will be harder because Lyza also runs on Linux and Mac systems. In fact, judging by the Mac-like interface, I suspect it wasn't developed on a Windows platform. According to Davis, performance isn’t very sensitive to adding memory beyond 1 GB, but high speed disk drives do help once you get past 10 million rows or so. The absolute limit on a 32 bit system is about 2 billion rows, a constraint related to addressable memory space (2^31 = about 2 billion) rather than anything peculiar to Lyza. Lyza can also run on 64 bit servers and is certified on Intel multi-core systems.

Enough about scalability. I haven’t done justice to Lyza’s interface, which is quite good. Most actions involve dragging objects into place, whether to add a new step to a process flow, move a field from one flow stage to the next, or drop measures and dimensions onto a report layout. Being able to see the data and reports instantly is tremendously helpful when building a complex processing flow, particularly if you’re exploring the data or trying to understand a problem at the same time. This is exactly how most analysts work.

Lyza also provides basic statistical functions including descriptive statistics, correlation and Z-test scores, a mean vs. standard deviation plot, and stepwise regression. This is nothing for SAS or SPSS to worry about; in fact, even Excel has more options. But it’s enough for most purposes. Similarly, data visualization is limited compared to a Tableau or ADVIZOR, but allows some interactive analysis and is more than adequate for day-to-day purposes.

Users can combine several reports onto a single dashboard, adding titles and effects similar to a Powerpoint slide. The report remains connected to the original workflow but doesn’t update automatically when the flow is rerun.

Intriguingly, Lyza can also display the lineage of a table or chart value. It traces the data from its source through all subsequent workflow steps, listing any transformations or selections applied along the way. Davis sees this as quickly answering the ever-popular question, “Where did that number come from?” Presumably this will leave more time to discuss American Idol.
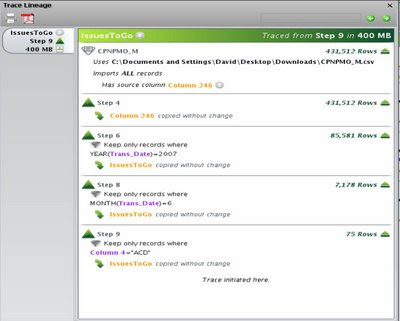

Users can also link one workflow to another by simply dragging an object onto a new worksheet. This is a very powerful feature, since it lets users break big workflows into pieces and lets one workflow feed data into several others. The company has just taken this one step further by adding a collaboration server, Lyza Commons, that lets different users share workflows and reports. Reports show which users send and receive data from other users, as well as which data sets send and receive information from other data sets.

Those reports are more than just neat: they're documenting data flows that are otherwise lost in the “shadow IT” which exists outside of formal systems in most organizations. Combined with lineage tracing, this is where IT departments and auditors should start to find Lyza really interesting.

A future version of Commons will also let non-Lyza users view Lyza reports over the Web – further extending Lyza beyond the analyst’s personal desktop to be an enterprise resource. Add in the 64-bit capability, an API to call Lyza from other systems, and some other tricks the company isn’t ready to discuss in public, and there’s potential here to be much more than a productivity tool for analysts.

This brings us back to pricing. If you were reading closely, you noticed that little comment about Lyza being priced under $1,000. Actually there are two versions: a $199 Lyza Lite that only loads from Microsoft Excel, Access and text files, and the $899 regular version that can also connect to standard relational databases and other ODBC sources and includes the API.

This isn’t quite as cheap as it sounds because these are one year subscriptions. But even so, it is an entry cost well below the several tens of thousands of dollars you’d pay to get started with full versions of QlikView or ADVIZOR, and even a little cheaper than Tableau. The strategy of using analysts’ desktop as a beachhead is obvious, but that doesn’t make it any less effective.

So, should my friends at QlikView be worried? Not right away – QlikView is a vastly more mature product with many features and capabilities that Lyza doesn’t match, and probably can’t unless it switches to an in-memory database. But analysts are QlikView’s beachhead too, and there’s probably not enough room on their desktops for both systems. With a much lower entry price and enough scalability, data manipulation and analysis features to meet analysts’ basic needs, Lyza could be the easier one to pick. And that would make QlikView's growth much harder.

----------------------------

*ADVIZOR Solutions and Tableau Software have excellent visualization with an in-memory database, although they’re not so scalable. PivotLink, Birst and LucidEra are on-demand systems that are highly scalable, although their visualization is less sophisticated. Here are links to my reviews: ADVIZOR , Tableau, PivotLink, Birst and LucidEra.

Tuesday, April 14, 2009

LeadLife Mixes Advanced and Simple Features

I have my little checklist of features to define whether a demand generation system is suited for simple or complex marketing programs. (You'll find most of the list in our report on Vendor Usability Scores on the Raab Guide site.) Sadly, some vendors didn't get the memo and have built products that straddle my categories.

Consider LeadLife. It offers many features that appeal to large marketing departments: fine-grained user rights management, rule-based content selection, multiple scores per lead, central processes to score leads and transfer them to sales, APIs to integrate with external Web forms, campaign cost tracking, detailed ROI reporting, and project management with tasks. But it lacks other features that are equally advanced: approval workflows, templates linked to deployed content, split tests, campaign actions to update data values, support for channels beyond email, and, most important, any way to direct leads from one campaign to another.

One way to explain this particular mix of features is to note that LeadLife’s founders previously sold sales automation software. Many of LeadLife's strengths and weaknesses are typical for sales automation systems.

Of course, Joe the Marketer won't care about my classification scheme. LeadLife president Lisa Cramer says the system is targeted at mid-size firms (which she defines as 25 or more employees), not large enterprises, and she should know. Still, it’s probably significant that “flexibility,” not simplicity, was the first term she used to describe the system. Her second term was “intuitive”, so she wasn’t saying the system is designed only for expert users. To me, those terms reflect an ambition to support more than just the simplest marketing programs.

I did in fact find the user interface in LeadLife to be particularly well designed. It follows some principles I first heard many years ago, the gist of which was to divide the screen into fixed regions that always display the same type of information (e.g., navigation folders on the left, detail data in the center) and avoid windows that pop up and disappear in random locations. Today that looks a bit old-fashioned, but it really does make things easier because users always know what to expect. On the other hand, LeadLife has inexplicably chosen a green-based color scheme that can only be described as institutional.

I’ll forgive them the color scheme because LeadLife had the good sense to agree with me on the much more important issue of flow-chart vs. step-based campaign design. LeadLife campaigns are defined strictly as a list of steps, without any branching at all – not even the if/then/else logic that some vendors embed within a single step. In fact, Cramer told me that LeadLife originally tried a flow chart approach, but discarded it because clients got lost. My point exactly.

Notwithstanding the austere simplicity of its campaign flows, LeadLife is a very powerful system. Emails, landing pages and Web surveys all support rule-driven content selection, which lets the system send different messages in different situations even without conventional branching. Rules can dynamically select survey questions, so a single survey page can ask the same visitor different questions over time. Users build emails and Web pages by positioning objects (text, data entry fields, images, etc.) in layers. This allows more flexibility than conventional methods, although it also opens new opportunities for errors. The system incorporates SpamAssassin spam scoring and is exploring how to add preview rendering for different ISPs. Marketing materials, including downloadable documents as well as emails and Web pages, can be shared across several campaigns.

The campaigns themselves can contain multiple events such as trade shows, Webinars, newsletters and surveys. Leads can be assigned to an event with a list or posted to the event from a Web form. The system keeps track of all events each lead is linked to and uses events as its primary vehicle for marketing performance measurement.

Leads can also be added to a campaign through queries against the system database. Queries can reference pretty much any data in the system, including survey responses and activity details. The query builder is quite sophisticated, allowing queries to incorporate multiple data elements and to scan for multiple values and substrings. Advanced users can view and modify the underlying SQL if they wish. The same interface is used to set up selections, campaign conditions, and lead scoring.

Once a query is created, the user can export the selected records, send them an email, or update data on their records. Queries execute continuously as data changes. This lets a campaign attached to a query react immediately as new members become qualified.

Users can combine a sequence of steps into a single campaign. Each step is either a query condition, which must be met for the lead to continue through the sequence, or an action. Conditions can also define waiting periods in multi-step campaigns. The only available actions are different types of emails. Cramer said that LeadLife originally allowed other actions, but removed these for simplicity. The company is considering adding some new actions, including one to direct leads from one campaign to another.

The system already provides an unusually rich set of administration functions. Campaign events can be assigned expenses, goals, budgets and activities such as notes, appointments, and tasks. Task attributes can include due dates, responsible individuals, billable time, and status. Access to system functions is managed by user groups, and at last count could be tailored to control 656 specific capabilities.

Lead scoring is also quite sophisticated. Users set up lead scoring rules, which run outside of campaigns but can be limited to members of a particular campaign or event. Each rule contains a query condition and number of points earned for meeting that condition. Users can also define several scores per lead and specify which score a given rule will update. The system can be set to score a rule just once, thereby capping the number of points derived from a particular type of event. Users can also define “decay” rules that reduce a lead’s total score after a specified period without activity. The system updates scores for each lead every few minutes.

Users also define one or more scoring processes, which can assign lead status (new, open, contacted, qualified, etc.) and execute actions when leads meet status and score thresholds. Actions can send the lead to the CRM system, assign the lead to an owner, and send the owner an email. LeadLife has existing integration Salesforce.com and could connect with other CRM systems via the system API. Users can define up to sixteen user-assigned fields on the lead record, plus an unlimited number of survey responses.

LeadLife provides full Web analytics, fueled by tracking codes on vendor-created and external Web pages. Campaign reports show activity counts (emails sent, opens, links clicked, etc.) and let users drill into the reports to see the individuals, and then drill further to see all activities for a selected individual. Other reports can list individuals by status, by products purchased, by contact recency, and other attributes. The system calculates ROI for each event within a campaign, drawing on the cost figures entered by the user and on revenues imported from CRM opportunity records. Revenue is attached to the earliest event associated with a lead linked to the opportunity.

Pricing is based on primarily on email volume. It starts at $500 per month for 1,500 emails and reached $1,395 for a more practical 25,000 emails. Each price includes all system features, unlimited Web volume, and five users. Additional users cost $10 to $30 per month depending on the user type. There are no additional fees for set-up, implementation or training. A quick implementation program aims at executing the client’s first campaign in three days. The company requires a one year contract but clients can leave within the first 90 days without further payment.

LeadLife was established in 2006 and released its first version in September 2008. The company now has about 20 clients.