Monday, September 03, 2012
Moving On: Lessons from the B2B Marketing Trenches
I’ve just ended my six month tour as VP Optimization at LeftBrain DGA, and am now returning full time to my usual consulting, writing, and general shenanigans. It was fun to work again as a hands-on marketer. Here are some insights based on the experience.
- lots of content. We all know that content is king, but sometimes forget the king has a voracious appetite. A serious demand generation program might move contacts through half dozen stages with several levels within each stage and several messages within each level. This could easily come to forty or fifty messages, each offering a different downloadable asset. The numbers go even higher when you start to create separate streams for different personas. Building these materials is major undertaking, first to understand what’s appropriate and then to create it. But deploying the initial content is just the start: you then have to monitor performance, test alternatives, and periodically refresh the whole stream. Finding efficient ways to do this is critical to keeping costs and schedules within reason. (Note that I’m talking here about email programs to nurture known contacts, not acquisition programs to attract new names. That takes another massive content collection.)
- content isn’t everything. It’s an old saw among direct marketers that the list determines most of your response rate and the offer controls for most of the rest. Actual creative execution (copy, graphics, format, etc.) accounts for maybe 10% of the result. We proved this repeatedly with tests that used the different content at the same stage in the campaign flow: basically, results were similar even with content originally designed for different purposes. Conversely, the same piece of content had hugely different results at different places in the flow. What this meant in both cases was that response was primarily driven by the people at each stage, not by the specifics of the materials presented.
- simplicity helps. That results are primarily driven by audience doesn’t mean that content doesn’t matter. We did a fascinating (to me, at least) analysis of 100 emails, logging specific features such as number of words and readability scores and then comparing these against open, click-through, and form submit rates. A clear pattern emerged: simpler emails (shorter, fewer graphics, easier to read) performed better. In fact, the pattern was so clear that there's a danger of over-reaction: at some point, a message can be too short to be effective (think of the mayor in The Simpsons, who just repeats “Vote for Me”). So the real trick is to find an optimal length, and even then to recognize that some messages truly need to be longer than others.
- simplicity isn’t everything, either. We did a lot of testing – it was my favorite part of my job – but the content tests were often inconclusive: sometimes shorter won, sometimes longer won, most often the difference was too small to matter. Given that we were starting with competently-created materials, that’s not too surprising. On the other hand, we consistently found that forms with fewer questions yielded better results, typically by a ratio of 3:1. This is one example of a non-content item with major impact; another was contact frequency (more is better, but, as with simplicity, only up to a point). There were other aspects of program structure that I would have tested had time and resources permitted; the goal was to focus on variables with the potential for a substantial impact on over-all results. This generally meant moving beyond individual content tests to items with larger and more global impact.
- test themes, not details. Don’t misinterpret that last sentence: I’m not against content tests. What I'm against is tests that only teach one small, random lesson, such as whether subject line A is better than subject line B. The way to build more powerful tests is to build them around a hypothesis and then try several simultaneous changes that support or refute that hypothesis. (I’ve shamelessly stolen this insight from Marketing Experiments, whose methodology I hugely admire and highly recommend.) So, if you think simplicity is an issue, create one test with shorter subject line and less copy and fewer graphics and a simpler call to action, and run that against your control. This is exactly the opposite of conventional testing advice of changing just one thing at a time. That approach made sense back in the days of direct mail when you were running a handful of versions per year, but isn’t an option in the content-intensive environment of modern online marketing. And even if you had the resources to run a gazillion separate tests, you’d still need to see larger patterns to guide your future content creation.
- multivariate tests work. As if the infinite number of potential tests were not enough of a challenge, most B2B marketers also have relatively small program quantities to work with. We multiplied our test volume by applying multivariate test designs, which let us use the same contacts in several different test cells simultaneously. This probably needs a post of its own, but here's a quick example: Let’s say you need 10,000 names per test cell and have 20,000 names total. Traditionally, you could just run one test comparing two choices. But with a multivariate design, you’d create four cells of 5,000 each. Cells 1 and 2 would get the first version of the first test, while cells 3 and 4 would get the second version. But – and here’s the magic – cells 1 and 3 would also get the first version of the second test, while cells 2 and 4 would get the second version of the second test. Thus, each test gets the required 10,000 names, but you can still see the impact of each test separately. (Here’s a random article that seems to do a good job of explaining this more fully.). We generally limited ourselves to two or three tests at a time. More complicated structures are possible but I was always concerned about keeping execution relatively simple since we were doing all our splitting manually.
- metrics matter. As it happens, most of the programs we executed rely heavily on form submissions to move people to the next stage. This meant that form fills were the key success metric, not opens or click-throughs. Although these generally correlate with each other, the relationship is weaker than you might expect. Some exceptions were due to obvious factors such as differences in form length, but the reasons for others were unknown. (I often suspected but could never prove reporting or data capture issues.) Of course, most email marketers are used to looking at open and click rates, so it took some gentle reminding to keep everyone focused on the form fill statistics. The good news is we prevented some pretty serious mistakes by using the right measure. Note that form fills are especially important in acquisition programs responders are lost altogether if don't complete a form that let you add them to your database.
- test results need selling. As you’ve probably guessed by now, I spent much of time lovingly crafting our tests and analyzing the results. But others were not so engaged: more than once, I was asked what we found in a test whose results I had published weeks before. This wasn’t a complete surprise, since other people had many other items on their mind. But we did eventually conclude that simply publishing the results was not enough, and started to go through the results in person during weekly and monthly status meetings. We also found that reviewing individual results was not enough; when we found larger patterns worth reporting, we had to present them explicitly as well. Again, there’s no surprise in this, but it does bear directly on expectations that managers will find important data if reporting systems simply make it available. Most will not: the systems have to go beyond reporting to highlight what’s new, what it means, why it matters, and what to do next. Although some parts of that analysis can be automated, most of it still relies on skilled human effort.
- reports need context. Reporting was another of my responsibilities, and we made great strides in delivering clearer and more actionable data to our clients. One of the things I already knew but was reminded really matters was the importance of putting data in context. It wasn’t enough just to show cumulative quantities or conversion statistics; we needed to compare this data with previous results, targets, and other programs to give a sense of what it meant. To take one example, we reported the winner of a series of email package tests, without realizing until late in the analysis that the response rate for the test as a whole was much lower than previous results. This was a more important issue that the tests themselves. We had other instances where entire waves were missing from reports; we only uncovered this because someone noticed they were missing – whereas, a proper comparison against plan would have highlighted it automatically. Again, such comparisons are widely acknowledged as a best practice: my point here is they have immediate practical value, so they shouldn't just be relegated to the list of “nice but not necessary” things that no one ever quite gets around to doing.
- survival is more important than conversion. That phrase has a vaguely religious ring to it, and I suppose it’s also true in a theological sense. But right now I’m talking about reporting of survival rates (how many people who enter a nurture program actually end up as customers) vs. conversion rates (how many people move from one program stage to the next). Marketers tend to focus on conversion rates, and of course it’s true that the survival rate is mathematically the product of the individual conversion rates. But we repeatedly saw changes in program structure or even individual treatments that caused large swings in a single conversion rate, which was often balanced by opposite changes in the following stage. Looking at conversion rates in isolation, it was hard to see those patterns. This was an even bigger problem when each rates was calculated cumulatively, so the impact of a specific change was masked by being merged into a larger average. More important, even when there was an obviously related change in two successive rates, the net combined impact wasn’t self-evident. This is where survival rates come in, since they directly report the cumulative result of all preceding stages. Of course, conversion rates and survival rates are both useful: I'm arguing you need to report them both, not just conversion rates alone.
- throughput matters. Survival and conversion rates show the shape of the funnel, but not the dimension of time. We did report how long it took contacts to move through our programs – in fact, a sophisticated and detailed approach was in place before I arrived – but the information was largely ignored. That was a pity, because it contained some important insights about contact behaviors, opportunities for improvement, and results of particular tests. A greater focus on comparing expected vs. actual results would have helped, since calculating the expectations would have probably required a closer focus on how long it took leads to move through the funnel.
- acceleration is hard. A greater focus on timing would have also forced a harder look at the fundamental premise of many B2B campaigns, which is that they can speed movement of prospects through the sales funnel. The more I think about this, the more doubts I have: B2B purchases move according to their own internal rhythms, driven by things like budget cycles, contract expirations, and management changes. Nurture programs can educate potential buyers and build a favorable attitude towards the seller, thereby increasing the likelihood of making a sale once the buyer is ready. They can also track, through lead scoring, when a buyer seems ready to act and is thus ripe for contact by sales. That’s all good and valuable and should more than justify the nurture program’s existence. But expectations of acceleration are dangerous because they may not be met, and could unfairly make a successful program look like a failure.
- drip needs attention. Like that leaky faucet you never quite get around to fixing, drip programs often don't get the attention they deserve. In practice, the vast majority of people who enter a nurture program will not move quickly to the purchase stage; most will stall somewhere along the way. This is where the drip program must work hard to keep them engaged. Again, every marketer knows this, but it’s easy to focus attention on the fascinating and complicated stage progressions (remember all that content?) and relegate the drip campaigns to a simple newsletter. Big mistake. Put as much effort into segmenting your drip communications and encouraging response as you put into stage conversions. If you want a practical reason for this, look at your mail quantities: chances are, you’re actually sending more drip emails than all your active stages combined.
- proving value is the ultimate challenge. It’s relatively easy to track contacts as they move through the marketing funnel, but it’s much harder to connect them to actual revenue in the sales or accounting systems. I whined about this at length in June, so I won’t repeat the discussion. Suffice it to say that some sort of revenue measurement, however imperfect, is necessary for your testing, reporting, and program execution to be complete.
Whew, it’s good to have all that out of my system. As I said at the beginning, I did enjoy my little visit to the marketing trenches. Now, it’s goodbye to that world and hello to what’s next.
Thursday, August 30, 2012
HubSpot's Latest Marketing Software Sends the Right Message
![]() |
| Poor targeting |
Specific changes include:
- a new contact database that is much more flexible than the original HubSpot database, allowing access to all types of email and landing page interactions within HubSpot and to social media activities imported to the system. The new database is built with HBase, which accesses Hadoop files. More on that later.
- “smart lists”, which are rule-based definitions of contact groups whose membership is updated automatically as contact data changes. Apologies if that’s a bit jargony; it just means the lists are always current.
- “smart calls to action” which are dynamic content blocks driven by the smart lists. That is, users define which contents go to members of different lists. The blocks are stored in a library and the same block can appear within multiple emails, HubSpot landing pages, or external Web pages. In practical terms, this means things like: users who have already downloaded one piece of content can automatically be offered something else.
- “smart forms” (do you sense a pattern?) which don't repeat questions a client has already answered. This isn’t quite true progressive profiling, which would replace questions that are answered with ones that are not. But it removes a major annoyance.
- workflows (hah! Bet you expected “smart flows”) that are triggered by smart list-style rules and can include multiple steps with multiple actions assigned to each step. Available actions include changing contact data, sending a record to CRM, updating a lead score, setting a lifecycle stage, and changing the call to action.
- social media tracking that captures responses to system-generated social media messages within the contact database. The responses are associated with specific individuals, so they can be used in smart lists and workflow rules.
- iPhone apps to view some reports and individual contact data
This is all good stuff, although far from revolutionary. Dynamic email content, for example, is available in 14 of the 22 systems in our VEST report. HubSpot recognizes that these are not new features but argues they’ve made them easier to use than competitors. I’m not so sure – the rule builder underlying the smart lists and workflows looks pretty much like every other rule builder, and the workflows themselves are also similar to the sequential flows in other systems.
This isn’t a criticism of HubSpot, but just a recognition that these are inherently complicated features which plenty of smart people have already tried to simplify. Radically better approaches may yet be found – I had an interesting chat about some possibilities with HubSpot co-founder Dharmesh Shah – but so far, the state of the art is what it is.
The new release also includes improved email and landing page designers, A/B testing for landing pages (not available in the entry-level version of the system, alas), enhancements to the app and service marketplaces, and expanded training services. The company said the coming year will bring enhancements to existing components including the blogging and search engine optimization applications.
What’s really important about all these changes is not whether they’re unique, but how well HubSpot has pulled them together and how it teaches its clients and resellers to use them. This is where HubSpot has always been strongest, and the vision it set out this week – of highly relevant marketing messages for each individual – is indeed advanced. (It’s also one I agree with – see this post on why the marketing funnel is dead.) If HubSpot can get marketers to focus on that sort of targeting, which is quite different from traditional campaign-oriented promotions, they can indeed have a revolutionary impact on their clients and the marketing industry.
And what about HBase? Although HubSpot didn’t talk about it in its marketing materials, switching from a conventional relational database to the Hadoop-based system is almost certainly the most radical feature of the new release. So far as I know, HubSpot is the only marketing automation system using HBase.
I discussed this a bit with HubSpot Chief Product Officer David Cancel, who joined the company when it acquired Performable, which was itself built on HBase. Cancel said HBase takes more resources than a conventional database engine but provides direct access to all details of each contact’s behavior history. One immediate benefit is that HubSpot now allows custom fields – up to 1,000, in fact – which it didn’t previously. Ad hoc reports against the HBase data isn't available yet but is due before the end of 2012.
Longer term, I suspect HBase will make it easier to add custom objects and to deal with unstructured and semi-structured data such as Web logs and text comments. This could make HubSpot fundamentally more flexible than most B2B marketing automation systems, whose data structures are tightly linked to CRM data structures. As I mentioned last week, the main exceptions to that rule today are the high-end marketing automation products, which were built for consumer marketing applications and assume a custom data structure. Having that flexibility in product for small-to-mid-size businesses could open up some possibilities that truly do make HubSpot unique.
(Wondering about the alligator man picture? Well, one of the sessions at the HubSpot conference said that having pictures in your blog posts increases readership, so I thought I'd give it a try. If you want me to justify that particular image: she's getting a message she doesn't want.)
Thursday, August 23, 2012
Raab Report: Act-On, Eloqua, Pardot, and Marketo Vie to Lead in Mid-Size B2B Marketing Automation Segment
Today I’ll present the third and (mercifully?) final installment in my series of posts on leaders in the different B2B marketing automation sectors, as determined by the ratings in our VEST report. I’ve saved the best for last, in the sense that the small to mid-size sector is the heart of the industry and its most complicated arena.
We define small to mid-size business as companies with $5 million to $500 million revenue. This covers a broad range of marketing users with widely varied needs. Most require the full set of marketing automation functions but apply these in simple ways. They have one to fifteen marketing automation users. This sector generates nearly 60% of 2012 revenue ($200 million) from 33% of the installations (9,400 as of mid-2012). The VEST report provides separate client counts for small business ($5 million to $20 million revenue) and mid-size business ($20 million to $500 million). These account for 16% and 41% of revenue and 16% and 17% of installations, respectively. Although small businesses generally buy lower-priced systems, they have largely the same requirements as mid-size companies.
The leaders quadrant in this sector is quite crowded, with Act-On, Eloqua, Pardot, and Marketo all jostling for position. Silverpop, Neolane, and Genius are all lurking nearby. In case you haven’t caught on to my color coding, blue type indicates that Eloqua and Neolane are leaders in the large company segment, while red type shows the others have their strongest position in this sector.
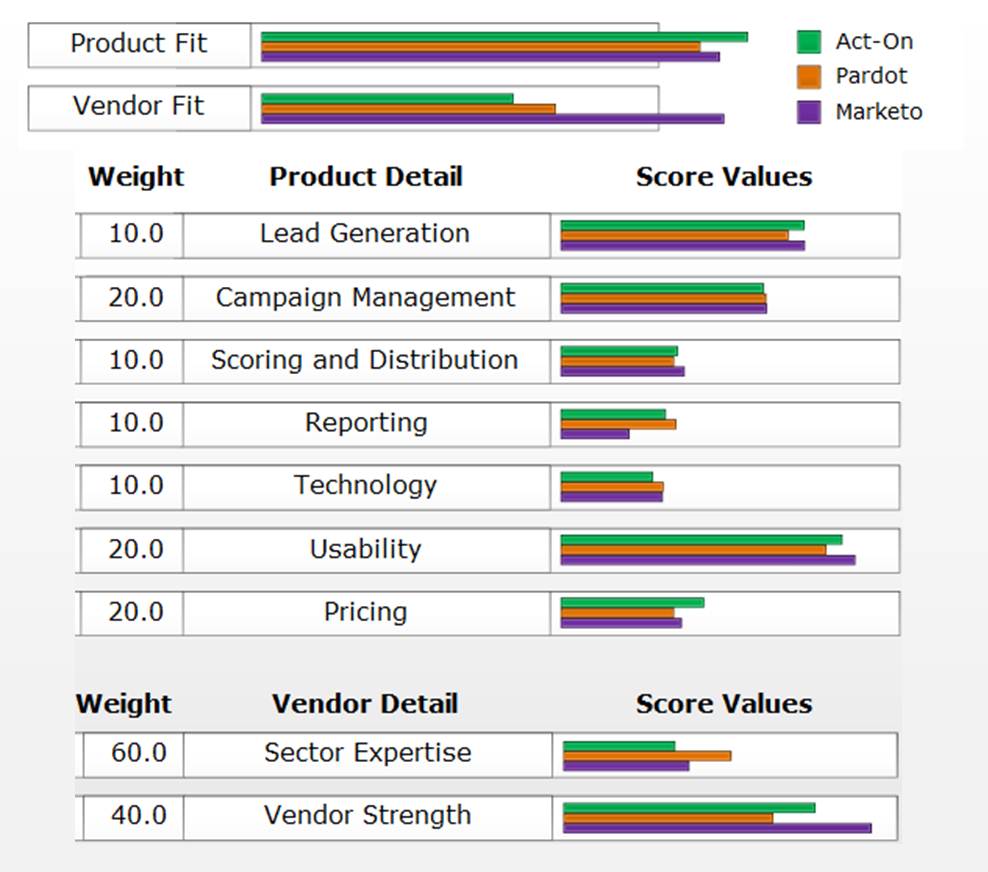
The variety of users within this segment is reflected by the differences among the leaders. Act-On, Pardot, and Genius specialize in smaller companies than Marketo or Silverpop, which in turn serve generally smaller clients than Eloqua or Neolane. Act-On’s position on top of the product fit range is a bit misleading: when you look at the components of that score (see below; this comparison chart is another VEST feature), the vendors are all very close. In fact, the only category where Act-On scores higher than everyone else is pricing.
This isn’t at all to say that the products are equivalent. Rather, it means they each have different strengths and weaknesses that balance each other out when measured with generic scoring weights. For actual buyers with clear priorities, the difference among these vendors’ scores will almost always be much larger.
As with the other sector charts, the vendors in the upper left are also worth considering: they have strong product fit but relatively low market position. SalesFusion appears here as it did in the micro- and large-business charts: what can I say, they have rich features at a good price. (And, no, they’re not my client.) eTrigue is the other noteworthy contender; it and LeadFormix are both close to the leader quadrant based on their vendor fit.
If there’s any one lesson from all these charts, it’s that picking the “leading” vendor is no guarantee of making a good choice. Our three sets of weights yield different sets of leaders, and even those vendors have different strengths and weaknesses. I’ve said it a million times but I’ll say it again: there’s no substitute for understanding your own needs and finding out which vendors match them best.
We define small to mid-size business as companies with $5 million to $500 million revenue. This covers a broad range of marketing users with widely varied needs. Most require the full set of marketing automation functions but apply these in simple ways. They have one to fifteen marketing automation users. This sector generates nearly 60% of 2012 revenue ($200 million) from 33% of the installations (9,400 as of mid-2012). The VEST report provides separate client counts for small business ($5 million to $20 million revenue) and mid-size business ($20 million to $500 million). These account for 16% and 41% of revenue and 16% and 17% of installations, respectively. Although small businesses generally buy lower-priced systems, they have largely the same requirements as mid-size companies.
The leaders quadrant in this sector is quite crowded, with Act-On, Eloqua, Pardot, and Marketo all jostling for position. Silverpop, Neolane, and Genius are all lurking nearby. In case you haven’t caught on to my color coding, blue type indicates that Eloqua and Neolane are leaders in the large company segment, while red type shows the others have their strongest position in this sector.
The variety of users within this segment is reflected by the differences among the leaders. Act-On, Pardot, and Genius specialize in smaller companies than Marketo or Silverpop, which in turn serve generally smaller clients than Eloqua or Neolane. Act-On’s position on top of the product fit range is a bit misleading: when you look at the components of that score (see below; this comparison chart is another VEST feature), the vendors are all very close. In fact, the only category where Act-On scores higher than everyone else is pricing.
This isn’t at all to say that the products are equivalent. Rather, it means they each have different strengths and weaknesses that balance each other out when measured with generic scoring weights. For actual buyers with clear priorities, the difference among these vendors’ scores will almost always be much larger.
As with the other sector charts, the vendors in the upper left are also worth considering: they have strong product fit but relatively low market position. SalesFusion appears here as it did in the micro- and large-business charts: what can I say, they have rich features at a good price. (And, no, they’re not my client.) eTrigue is the other noteworthy contender; it and LeadFormix are both close to the leader quadrant based on their vendor fit.
If there’s any one lesson from all these charts, it’s that picking the “leading” vendor is no guarantee of making a good choice. Our three sets of weights yield different sets of leaders, and even those vendors have different strengths and weaknesses. I’ve said it a million times but I’ll say it again: there’s no substitute for understanding your own needs and finding out which vendors match them best.
Raab Report: Neolane, Aprimo, and Eloqua Rate Highest for Large Company B2B Marketing Automation
Tuesday’s post looked at the micro-business sector leaders according to our VEST report and gave a bit of background on how the ratings are created. Today let's take a look at the same diagram for large businesses, which we define as companies with $500 million revenue or more.
These companies have large marketing departments that may manage hundreds of campaigns for different products in different locations. Our scoring reflects their need for special features for automated content selection, project management, complex lead scores, and tight control over the rights granted to individual users. This group had about 1,400 clients in mid-2012, generating an estimated $85 million in revenue. This is 5% of industry installations and 25% of industry revenue. Many of these were small departmental implementations; there are probably fewer than 500 true enterprise-wide deployments. The non-specialist vendors such as IBM Unica and SAS, are not included in these figures but also have significant revenue in this segment.
As before, vendors closer to the top have the most appropriate features for this segment, and those further to the right have the most similar customer base and company resources. The chart shows Neolane and Aprimo (owned by Teradata) as the clear leaders, with Eloqua also very strong. Marketo and Oracle (specifically, Oracle CRM On Demand Marketing) are considerably further back in the leader quadrant.
It’s important to recognize that Neolane and Aprimo are fundamentally different from the others. Both are general purpose marketing automation systems that serve large numbers of B2C as well as B2B clients. The clearest technical distinction is the marketing database: Neolane and Aprimo are designed to connect with custom-built, external marketing databases, whereas B2B marketing automation products like Eloqua, Marketo, and Oracle are based on an integrated database using a CRM data model (usually Salesforce.com, although Oracle is tied to Oracle's own CRM). This doesn’t mean that every client actually connects them to CRM system. But it does mean that the standard data models match the CRM data models and, in many cases, that abilities to expand the data model with custom tables are limited. One reason that Neolane and Aprimo rank so high in this sector is, precisely, that large businesses often want more database flexibility than the CRM-based approach allows.
As with Tuesday’s chart, the other important place to look on the chart is the upper left, which captures companies that have suitable features for this segment but are too small to rate as leaders. SalesFusion (which also ranked highly in the micro business segment; a good trick) and TreeHouse Interactive stand out in that region. So does MarketingPilot, a newcomer to the VEST that is more like Neolane and Aprimo in serving a mix of B2C and B2C clients. See my 2011 MarketingPilot review for more details, bearing in mind that they’ve added capabilities since then.
These companies have large marketing departments that may manage hundreds of campaigns for different products in different locations. Our scoring reflects their need for special features for automated content selection, project management, complex lead scores, and tight control over the rights granted to individual users. This group had about 1,400 clients in mid-2012, generating an estimated $85 million in revenue. This is 5% of industry installations and 25% of industry revenue. Many of these were small departmental implementations; there are probably fewer than 500 true enterprise-wide deployments. The non-specialist vendors such as IBM Unica and SAS, are not included in these figures but also have significant revenue in this segment.
As before, vendors closer to the top have the most appropriate features for this segment, and those further to the right have the most similar customer base and company resources. The chart shows Neolane and Aprimo (owned by Teradata) as the clear leaders, with Eloqua also very strong. Marketo and Oracle (specifically, Oracle CRM On Demand Marketing) are considerably further back in the leader quadrant.
It’s important to recognize that Neolane and Aprimo are fundamentally different from the others. Both are general purpose marketing automation systems that serve large numbers of B2C as well as B2B clients. The clearest technical distinction is the marketing database: Neolane and Aprimo are designed to connect with custom-built, external marketing databases, whereas B2B marketing automation products like Eloqua, Marketo, and Oracle are based on an integrated database using a CRM data model (usually Salesforce.com, although Oracle is tied to Oracle's own CRM). This doesn’t mean that every client actually connects them to CRM system. But it does mean that the standard data models match the CRM data models and, in many cases, that abilities to expand the data model with custom tables are limited. One reason that Neolane and Aprimo rank so high in this sector is, precisely, that large businesses often want more database flexibility than the CRM-based approach allows.
As with Tuesday’s chart, the other important place to look on the chart is the upper left, which captures companies that have suitable features for this segment but are too small to rate as leaders. SalesFusion (which also ranked highly in the micro business segment; a good trick) and TreeHouse Interactive stand out in that region. So does MarketingPilot, a newcomer to the VEST that is more like Neolane and Aprimo in serving a mix of B2C and B2C clients. See my 2011 MarketingPilot review for more details, bearing in mind that they’ve added capabilities since then.
Tuesday, August 21, 2012
Raab Report: OfficeAutoPilot, Infusionsoft and HubSpot Rate Highest in Marketing Automation for Very Small Business
One of the most important features of our VEST report on B2B marketing automation systems is that it divides marketing automation users into distinct segments, each having a different set of needs. This matters because the systems all do roughly the same things, making it hard for inexperienced buyers to tell them apart. Many vendors – especially those who target the middle sector – also try to serve all types of companies, adding to the confusion. Where the vendors differ is in the details of how they implement the common features, applying approaches that are generally best suited to one type of marketing organization.
The VEST segmentation is based on company size, as measured by revenue. I'm painfully aware that this isn’t the ideal way to group users, since companies of the same size can still vary greatly in their needs and marketing sophistication. But revenue is objectively measureable and most marketing automation vendors can provide reasonably accurate client counts by revenue group. So we use it as a proxy for the other client differences.
The primary way we report on the different segments is by applying different weights to the same feature in our vendor scoring for each segment. This lets us rank vendors based on how their features and company strengths match against each sector’s needs. A key part of the approach is to penalize vendors with negative weights for features that are too advanced for a particular customer group. So far as I know, no other analysts do this in their scoring. It avoids a common problem with scoring systems, that systems with the most features always win.
The chart above shows our ratings for the micro business sector, defined as companies with under $5 million in revenue. These are very small companies, typically run personally by an owner. They rarely have a full-time professional marketer on staff. Primary marketing interests are group emails, landing pages, and simple lead nurturing through email auto-responders. Before marketing automation, they typically use an email system (which also provides landing pages and simple nurture campaigns) or sales automation product for their marketing. They often do not integrate marketing automation with a separate sales automation system, either because they don’t use one at all or because they rely on CRM features within marketing automation itself. As of July 2012, marketing automation vendors reported more than 17,000 micro-business installations, just over 60% of the industry total. But, because prices are lower than other segments, the segment generates only an estimated 18% of industry revenue, or $65 million for full-year 2012.
Companies in this sector have very limited marketing and technical resources. As a result, their overriding needs are ease of use and a broad range of features within a single product. What they don’t need are very complex campaigns, extensive planning and budgeting, and custom database designs. Our scoring reflects those priorities.
As the chart shows, the leaders in this segment are OfficeAutoPilot, Infusionsoft, and HubSpot. The first two are micro-business specialists; in particular, they have built-in CRM and order processing. HubSpot isn’t quite as highly tailored to this segment, which is why it is a little further from the top than the other two. (The vertical dimension is product fit, which basically means features.) But HubSpot has a very large number of clients in this segment, so it is still quite far to the right. (The horizontal dimension is vendor fit, a combination of customer count, segment concentration, and vendor resources.) Act-On and Marketo also have strong positions in this sector, even though their features – especially in Marketo’s case – are not necessarily the best fit. Again, bear in mind that revenue is a very crude segmentation, so many Act-On and Marketo clients in this group probably have requirements closer to those I’ve assigned to the middle tier.
The other important set of vendors are those at the upper left of the chart: companies with a strong feature fit even though they are smaller than the leaders. SalesFUSION and MakesBridge stand out especially in this group for micro-business users. Oracle’s presence is, frankly, pretty odd: it’s due to a low per seat price and the vendor’s position that it has a built-in CRM module. In fact, nine of the 22 vendors say they provide a CRM option, which may be technically correct but in most cases probably isn’t realistic. This is even more proof – as if it were needed – that buyers need to explore the products in detail before making a purchase.
Monday, August 20, 2012
Raab Report: B2B Marketing Automation Vendors Are Making Incremental, Not Radical, Changes To Their Products
Indeed, with 208 data points on 22 vendors, there’s so much data that it’s a challenge to make sense of it. The approach I settled on this time is to compare the average score of each item against its average in the previous edition, six months earlier. Since we only added one new vendor for this edition and kept all the old ones, the vendor base itself is largely stable. Items with the greatest change in average score are the ones that vendors are adapting most rapidly. (The scores are: 2=comply fully; 1=comply partly; 0=do not comply. So, a higher score indicates a more common feature. An item present in every system would have a score of 2.0. The actual average is 1.41.)
The table below shows the top 20 items based on this ranking. Colors in the “average score” column show the relative score of each item – closer to green means an item is more common; closer to red means it is more rare. The ranking is based on all 200 items, so the broad range among this group shows that all types of features are being added, not just the rare ones.
At first glance, these items seem almost random. But on closer examination, they fall into three categories.
• Sophisticated marketing programs. These are features for advanced outbound campaigns. This means they appeal to the most sophisticated marketers and are probably not very widely used. As hinted by the color coding and confirmed by group, these features are already relatively common. So their continued growth represents catch-up by vendors who had not already provided them, probably more for competitive sales reasons than actual customer needs.
• New channels. These are features for marketing outside of email. They include managing events such as trade shows, integrating with external Web sites, and support for fax and direct mail. As a group, these are more rare than the previous set (average score of 1.02 vs. 1.28), suggesting that vendors who add them are more leaders than followers. They illustrate the continued expansion of marketing automation to support true multi-channel marketing programs.
• Advanced marketing management. These are features to help manage large-scale marketing operations. They relate to administrative and reporting needs including fine-grained control over user access rights, detailed cost reporting, user interface in multiple languages, and control over large volumes of assets. Most of these features are still relatively rare, although the group average is raised by two relatively common items (templates that automatically copy changes into existing assets and reports on asset usage by campaign). As with the changes to support sophisticated marketing programs, these features are needed by a small fraction of marketers, but vendors are probably adding them because they appear on buyer checklists.
You may have noticed that social media is missing from these lists. Don’t be alarmed – it's just that most social media features were not covered in the previous edition, so we can't calculate growth rates. Here’s a list of all the new items and their scores. As you see, they’re all still relatively rare. I'm pretty sure that social media features are being added quickly although I don't have the data to prove it.
What didn’t grow so much? Well, there’s little change in basic marketing capabilities but that's just because pretty much everyone already has them. Less predictably, there’s little change in reporting, CRM integration, database design, features targeted at ease of use, content creation, and pricing models. If there’s a pattern here, it’s that these are fundamental aspects of system design and business models. In other words, vendors are making incremental enhancements rather than radical changes.
You can read this as a sign of maturity or stagnation. Maybe they're the same thing. Either way, it's arguably a good thing for marketers that the pace of change has slowed down a bit, since it gives them time to catch up. It's more dangerous for vendors, since a stable feature set is easier for outsiders to duplicate, and gorilla invasion is the biggest threat faced by existing marketing automation leaders. As my previous post reported, small vendors can still grow quickly enough to approach the industry's top ranks. But it's entry by large outsiders who can leverage an existing customer base, such as users of email, CRM, or Web content management systems, that could really change the industry structure overnight. Stay tuned.
Thursday, August 02, 2012
Raab Report: Financial Comparison of B2B Marketing Automation Vendors
I’ve been so busy analyzing the new VEST data that I missed the announcement that Eloqua’s would make its initial stock offering today. The valuation was a bit disappointing – $368 million, or just over four times revenue trailing 12-month revenue – but certainly a good return on its backers’ investment of about $41 million. And the stock did rise 12% on the first day. Good for them, and congratulations.
Coincidentally, I was already planning to write today about industry financials. I’ve been creeping in that direction with the previous two posts about revenues, growth rates, and market share. Now let’s plunge in with some more substantial analysis.
For companies like Eloqua and its competitors, there are really two big financial questions: how fast can they grow, and how can they become profitable? In a young industry like B2B marketing automation, the primary focus is growth, and I published some figures on that yesterday (repeated below). As we saw, Eloqua’s client count is growing considerably slower* than all major competitors except Infusionsoft. This may be one reason the stock market gave it a relatively conservative valuation.
Revenue figures tell a similar story, as does revenue per client. We looked at those in Tuesday’s post; I’ll repeat the caveat that figures for Eloqua and HubSpot are my own estimates based largely on client growth and (for HubSpot) changes in client mix. The standout performer in all these tables is Marketo, but bear in mind that they’ve also taken much more investment than any of the others ($107.5 million) and the $70 million in 2012 revenue hasn’t happened yet. Still, this suggests that Marketo might be able to fetch a higher price than Eloqua.
What about profitability? I’ll repeat that the financial markets care much less about profits than growth for early stage companies. Still, profits will have to matter eventually. So they're worth a look.
Eloqua is the only company in this group with published financial statements, so any profitability analysis has to be speculative. One useful measure is employee counts, which are a reasonable proxy for expenses and operating efficiency. The table below presents clients, employees, and clients-per-employee ratios.
The first thing you’ll notice is the broad range in clients-per-employee ratios: from 40:1 for Infusionsoft to less than 4:1 for Eloqua. The main reason is the size of each company’s clients – Infusionsoft serves small businesses that take much less effort per client than the mid-size and large companies who buy Eloqua.
Still, Marketo, Pardot, SalesFusion and Net-Results all serve primarily mid-size companies, so they are somewhat comparable. (Act-On tends a bit smaller.) Given that assumption, the figures suggest that Pardot, Net-Results and SalesFusion are more efficient than the others. That’s probably true, perhaps because they are all self-funded. Net-Results also markets primarily through resellers, which also lowers its costs. Act-On’s ratio is notably low, probably reflecting aggressive staffing as it prepares for rapid growth.
The second thing you’ll notice is the year-on-year trend. Infusionsoft, HubSpot, Act-On, and Net-Results all show a drop in the clients-per-employee ratio since last year, meaning they have become less efficient. We can probably attribute that to gearing up for growth. By contrast, Eloqua, Pardot and SalesFusion have become substantially more efficient. Eloqua’s gain is particularly impressive since it has the largest client base and relatively low growth – suggesting the company has been working hard to keep costs down in preparation for its public offering. It looks like Marketo has become just slightly more efficient, but we'll revise that opinion in a moment.
Since we do have revenue figures for the top four vendors, we can also look at their revenue per employee. This is a standard efficiency metric and more directly comparable across companies. Here's that data, along with revenue per client.
These figures put the client-per-employee ratios in deeper perspective. They confirm that Eloqua has improved efficiency, and by far the highest revenue per employee in the industry. The figures may be be overstated (see footnote) but even more conservative values would leave Eloqua in first place. The figures also confirm that Infusionsoft’s cost structure is pretty much stable.
The news is better for HubSpot, whose apparent productivity decrease (measured in clients-per-employee) vanishes when you measure revenue per employee instead. The difference is the growth in revenue per client (which, I’ll remind you again, is only my personal estimate).
The story is even more dramatic for Marketo, whose 6% improvement in clients per employee becomes a 23% gain in revenue per employee, boosted by a 16% increase in revenue per client. Impressive, but let's hold the applause until we see the actual results.
Whew, that’s a lot of numbers. Maybe only industry insiders will find them as interesting as I do. But other marketers should also find them helpful as they try to understand each vendor's business situation and determine how well it matches the marketer's own needs.
_________________________________________________________
* And that's using Eloqua-provided figures of 900 clients as of mid-2011 and 1,375 for mid-2012, which yield a 53% year-on-year growth rate. The revised S-1 published in mid-July showed 42% year-on-year revenue growth. A 42% growth rate would yield 2012 revenue of $101 million vs. my estimate of $110 million, and a 7% drop in revenue per customer to $73,455. Ouch! On the plus side, even the adjusted $288,571 revenue per employee is higher than anyone else, and a 16% improvement over 2011.
Coincidentally, I was already planning to write today about industry financials. I’ve been creeping in that direction with the previous two posts about revenues, growth rates, and market share. Now let’s plunge in with some more substantial analysis.
For companies like Eloqua and its competitors, there are really two big financial questions: how fast can they grow, and how can they become profitable? In a young industry like B2B marketing automation, the primary focus is growth, and I published some figures on that yesterday (repeated below). As we saw, Eloqua’s client count is growing considerably slower* than all major competitors except Infusionsoft. This may be one reason the stock market gave it a relatively conservative valuation.
Revenue figures tell a similar story, as does revenue per client. We looked at those in Tuesday’s post; I’ll repeat the caveat that figures for Eloqua and HubSpot are my own estimates based largely on client growth and (for HubSpot) changes in client mix. The standout performer in all these tables is Marketo, but bear in mind that they’ve also taken much more investment than any of the others ($107.5 million) and the $70 million in 2012 revenue hasn’t happened yet. Still, this suggests that Marketo might be able to fetch a higher price than Eloqua.
What about profitability? I’ll repeat that the financial markets care much less about profits than growth for early stage companies. Still, profits will have to matter eventually. So they're worth a look.
Eloqua is the only company in this group with published financial statements, so any profitability analysis has to be speculative. One useful measure is employee counts, which are a reasonable proxy for expenses and operating efficiency. The table below presents clients, employees, and clients-per-employee ratios.
The first thing you’ll notice is the broad range in clients-per-employee ratios: from 40:1 for Infusionsoft to less than 4:1 for Eloqua. The main reason is the size of each company’s clients – Infusionsoft serves small businesses that take much less effort per client than the mid-size and large companies who buy Eloqua.
Still, Marketo, Pardot, SalesFusion and Net-Results all serve primarily mid-size companies, so they are somewhat comparable. (Act-On tends a bit smaller.) Given that assumption, the figures suggest that Pardot, Net-Results and SalesFusion are more efficient than the others. That’s probably true, perhaps because they are all self-funded. Net-Results also markets primarily through resellers, which also lowers its costs. Act-On’s ratio is notably low, probably reflecting aggressive staffing as it prepares for rapid growth.
The second thing you’ll notice is the year-on-year trend. Infusionsoft, HubSpot, Act-On, and Net-Results all show a drop in the clients-per-employee ratio since last year, meaning they have become less efficient. We can probably attribute that to gearing up for growth. By contrast, Eloqua, Pardot and SalesFusion have become substantially more efficient. Eloqua’s gain is particularly impressive since it has the largest client base and relatively low growth – suggesting the company has been working hard to keep costs down in preparation for its public offering. It looks like Marketo has become just slightly more efficient, but we'll revise that opinion in a moment.
Since we do have revenue figures for the top four vendors, we can also look at their revenue per employee. This is a standard efficiency metric and more directly comparable across companies. Here's that data, along with revenue per client.
These figures put the client-per-employee ratios in deeper perspective. They confirm that Eloqua has improved efficiency, and by far the highest revenue per employee in the industry. The figures may be be overstated (see footnote) but even more conservative values would leave Eloqua in first place. The figures also confirm that Infusionsoft’s cost structure is pretty much stable.
The news is better for HubSpot, whose apparent productivity decrease (measured in clients-per-employee) vanishes when you measure revenue per employee instead. The difference is the growth in revenue per client (which, I’ll remind you again, is only my personal estimate).
The story is even more dramatic for Marketo, whose 6% improvement in clients per employee becomes a 23% gain in revenue per employee, boosted by a 16% increase in revenue per client. Impressive, but let's hold the applause until we see the actual results.
Whew, that’s a lot of numbers. Maybe only industry insiders will find them as interesting as I do. But other marketers should also find them helpful as they try to understand each vendor's business situation and determine how well it matches the marketer's own needs.
_________________________________________________________
* And that's using Eloqua-provided figures of 900 clients as of mid-2011 and 1,375 for mid-2012, which yield a 53% year-on-year growth rate. The revised S-1 published in mid-July showed 42% year-on-year revenue growth. A 42% growth rate would yield 2012 revenue of $101 million vs. my estimate of $110 million, and a 7% drop in revenue per customer to $73,455. Ouch! On the plus side, even the adjusted $288,571 revenue per employee is higher than anyone else, and a 16% improvement over 2011.
Wednesday, August 01, 2012
Raab Report: B2B Marketing Automation Industry Is Getting More, Not Less, Fragmented
I’ve gotten used to thinking of the B2B marketing automation industry as entering a consolidation phase, during which a handful of dominant vendors emerge and small vendors drop away. That’s why I was a bit surprised when yesterday’s blog post showed that the “big four” industry vendors (Infusionsoft, HubSpot, Marketo, and Eloqua) are actually growing slower than the “next four” largest (Pardot, Act-On Software, Net-Results, and SalesFusion)*. In other words, the industry is becoming less concentrated, at least for the moment.
In fact, this trend extends back for the past two years, which is as far as my VEST data goes. It likely extends still further, and, on reflection, this makes sense: at the start of a new industry, there are just one or two pioneering firms with no competition and, thus, 100% market share. This share can only drop over time as new entrants emerge. It's only in the later stages of consolidation – after crossing Geoffrey Moore’s chasm – that the dominant vendors really take control. For B2B marketing automation, we’re not there yet.
The table below shows all this in glorious detail: the big four vendors grew more slowly on a percentage basis than the next four, even though the big four added more clients in absolute terms. The figures for "other" are a bit misleading because the 2011 and 2012 figures include a few more companies than the 2010 data. But they're directionally correct.
Share of clients somewhat overstates the dominance of the big four because Infusionsoft and Hubspot serve such huge numbers of small companies. Revenue would be a better measure but I don’t have reliable figures for the smaller vendors. I do have employee counts, at least for the top eight companies. They make the next four look more important: while the next four have just 12% of the clients, they have 18% of the employees. This is up from 14% of employees a year ago, so the fundamental story is still the same: the next four are growing faster.
What all this means in concrete terms is that a new vendor can still challenge the current market leaders. Both Pardot and Act-On are doing exactly that. Their success isn’t guaranteed and it’s not clear how much longer the window of opportunity will remain open. But, for now at least, the game isn’t over.
______________________________________________________________________
* Actually, Genius should place in this group, since it has 900 clients. But that information reached me the day after this post was written. They're also growing much more slowly than the vendors listed here -- up from 700 clients a year prior (29% growth, vs. the 139% growth of the current "next four"). So I think the point about smaller vendors being able to grow quickly is better supported by keeping the existing data in place.
Raab Report: B2B Marketing Automation Revenues to Hit $525 Million in 2012
I’ve just released the latest edition of my B2B Marketing Automation Vendor Selection Tool (VEST), which contains detailed analysis of all 22 B2B marketing automation systems. Serious marketing of the new edition is yet to begin, but anyone considering purchase of a marketing automation system can buy the VEST now at the www.raabguide.com Web site.
The new report contains a rich trove of industry information. The one item that people usually find most interesting is the size of the industry. I put this at $325 million for 2011, a 50% increase from 2010. With 2012 half finished, I can now make a reasonably solid estimate for this year. I find the growth rate has actually accelerated to 60%, for a total of about $525 million.
I come at these figures in two ways.
Installations by industry sector. Vendors in the VEST are asked for estimates of their client counts by company size. We distinguish four segments: micro-business with under $5 million revenue; small business with $5 to $20 million revenue, mid-size business with $20 to $500 million revenue, and large business with over $500 million revenue. Most vendors do provide the sector breakdown, although some are pretty rough estimates. For a couple of vendors, I’ve used my own estimate based on past data.
Using the sector counts plus estimated revenue per client for each sector, I can calculate the revenue by sector and for the industry as a whole. Since the client counts are mid-year figures, they should roughly equal the full-year average. I’ve only included figures for vendors who specialize in B2B systems; none of the other vendors (Neolane, Oracle, Silverpop, Aprimo, MarketingPilot) are provided estimates of the B2B portion of their client base. The table below shows my calculations:
The total comes to $362 million estimated 2012 revenue. I estimate the non-B2B specialists and other marketing automation vendors (IBM, SAS, SAP, etc.) who are not listed in the VEST will have another $165 million in B2B revenue, for a total of $527 million.
Revenue estimates for individual vendors. The second approach starts with the four largest B2B specialists: Infusionsoft, HubSpot, Marketo, and Eloqua. Each has announced revenue for 2011 (formally or in press interviews) and two, Infusionsoft* and Marketo**, have made forecasts for 2012. I estimated 2012 revenues for HubSpot and Eloqua based on their client counts and revenue per client. I then estimated revenue for the other specialist vendors by combining results from two methods: estimated revenue per employee and estimated revenue per client. Finally, I’ve added figures for the non-specialist vendors, using the same assumptions as before. The table below shows the results.
As you see – and I swear I didn’t cook these numbers – this gives $525 million, almost exactly matching the other method.
Of course, there's more to these figures than just the industry size. One interesting point is that the “other specialist” vendors are actually growing faster than the big four vendors. This is a bit of a surprise, since we’d expect the industry to consolidate and squeeze out the smaller players. Still, remember that the big four control 75% of the revenue.
The difference is client growth actually larger than the revenue estimates suggest. The table below shows that the client base of the “other specialists” grew by 80%, which is faster than any of the big four.
One caveat is that a number of the smaller vendors didn’t provide updated client counts, and they may be vendors who were not growing much. But the reality is that the next three largest vendors (Pardot, Act-On, and Net-Results) did provide data, and each grew by well over 100%. So the missing vendors don't have enough volume to affect the big picture.
I’ll share one final set of data that also points to industry strength. The table below shows revenue per client for the big four vendors over the past two years. These are actuals except for the 2012 figures for HubSpot and Eloqua, and I consider those to be educated, conservative guesses.
This table shows a consistent increase in revenue per customer across all vendors and all years. Given the intense competition within the industry, that’s pretty impressive: it shows that the big four vendors are managing to increase their revenue per client, which all must do to become profitable. I suspect the increase is less the result of firmer pricing than of broader product lines that let the vendors sell more to each customer. Nor does this mean that industry prices are rising: it’s possible – in fact, likely – that the smaller vendors are selling for less than their larger competitors, and that the average price in the industry is still dropping.
All told, this paints the picture of a healthy industry: still growing rapidly, still open to competition, and supporting sustainable prices. It's a cheery bit of news.
_____________________________________________________________
*Infusionsoft "expected revenue of $40 million in 2012" (Customer Experience Matrix, April 14, 2012)
**Marketo "revenues last year grew 140% over the year to $35 million. Management expects revenues to double during this year" (Sramana Mitra blog interview with Phil Fernandez, July 21, 2012)
The new report contains a rich trove of industry information. The one item that people usually find most interesting is the size of the industry. I put this at $325 million for 2011, a 50% increase from 2010. With 2012 half finished, I can now make a reasonably solid estimate for this year. I find the growth rate has actually accelerated to 60%, for a total of about $525 million.
I come at these figures in two ways.
Installations by industry sector. Vendors in the VEST are asked for estimates of their client counts by company size. We distinguish four segments: micro-business with under $5 million revenue; small business with $5 to $20 million revenue, mid-size business with $20 to $500 million revenue, and large business with over $500 million revenue. Most vendors do provide the sector breakdown, although some are pretty rough estimates. For a couple of vendors, I’ve used my own estimate based on past data.
Using the sector counts plus estimated revenue per client for each sector, I can calculate the revenue by sector and for the industry as a whole. Since the client counts are mid-year figures, they should roughly equal the full-year average. I’ve only included figures for vendors who specialize in B2B systems; none of the other vendors (Neolane, Oracle, Silverpop, Aprimo, MarketingPilot) are provided estimates of the B2B portion of their client base. The table below shows my calculations:
The total comes to $362 million estimated 2012 revenue. I estimate the non-B2B specialists and other marketing automation vendors (IBM, SAS, SAP, etc.) who are not listed in the VEST will have another $165 million in B2B revenue, for a total of $527 million.
Revenue estimates for individual vendors. The second approach starts with the four largest B2B specialists: Infusionsoft, HubSpot, Marketo, and Eloqua. Each has announced revenue for 2011 (formally or in press interviews) and two, Infusionsoft* and Marketo**, have made forecasts for 2012. I estimated 2012 revenues for HubSpot and Eloqua based on their client counts and revenue per client. I then estimated revenue for the other specialist vendors by combining results from two methods: estimated revenue per employee and estimated revenue per client. Finally, I’ve added figures for the non-specialist vendors, using the same assumptions as before. The table below shows the results.
As you see – and I swear I didn’t cook these numbers – this gives $525 million, almost exactly matching the other method.
Of course, there's more to these figures than just the industry size. One interesting point is that the “other specialist” vendors are actually growing faster than the big four vendors. This is a bit of a surprise, since we’d expect the industry to consolidate and squeeze out the smaller players. Still, remember that the big four control 75% of the revenue.
The difference is client growth actually larger than the revenue estimates suggest. The table below shows that the client base of the “other specialists” grew by 80%, which is faster than any of the big four.
One caveat is that a number of the smaller vendors didn’t provide updated client counts, and they may be vendors who were not growing much. But the reality is that the next three largest vendors (Pardot, Act-On, and Net-Results) did provide data, and each grew by well over 100%. So the missing vendors don't have enough volume to affect the big picture.
I’ll share one final set of data that also points to industry strength. The table below shows revenue per client for the big four vendors over the past two years. These are actuals except for the 2012 figures for HubSpot and Eloqua, and I consider those to be educated, conservative guesses.
This table shows a consistent increase in revenue per customer across all vendors and all years. Given the intense competition within the industry, that’s pretty impressive: it shows that the big four vendors are managing to increase their revenue per client, which all must do to become profitable. I suspect the increase is less the result of firmer pricing than of broader product lines that let the vendors sell more to each customer. Nor does this mean that industry prices are rising: it’s possible – in fact, likely – that the smaller vendors are selling for less than their larger competitors, and that the average price in the industry is still dropping.
All told, this paints the picture of a healthy industry: still growing rapidly, still open to competition, and supporting sustainable prices. It's a cheery bit of news.
_____________________________________________________________
*Infusionsoft "expected revenue of $40 million in 2012" (Customer Experience Matrix, April 14, 2012)
**Marketo "revenues last year grew 140% over the year to $35 million. Management expects revenues to double during this year" (Sramana Mitra blog interview with Phil Fernandez, July 21, 2012)
Tuesday, July 10, 2012
The Marketing Funnel Is Dead. Let's Have Dessert.
Last week’s post on lead scoring attracted more positive attention than I expected. This was doubly surprising because first, I didn’t think lead scoring was such a hot topic and second, I don’t really agree with the approaches I described.
To clarify that second point, I’m not saying what I wrote was wrong or insincere. Rather, I consider it an accurate description of an approach I find problematic. The approach was using lead scoring as a way to define lead stages. My problem is the concept of lead stages themselves.
This verges on heresy, but I’m having an increasingly hard time with lead stages as a way to organize a marketing program. Of course, stages make perfect intuitive sense, and they’re ultimately based on the AIDA (Awareness, Interest, Desire, Action) model of the sales process that has been around for more than 100 years.*
But we all know in our heart of hearts that real buyers don’t follow such an orderly sequence. Indeed, there has been a fair amount of research questioning the validity of AIDA and similar “hierarchy of effects” models. The fundamental criticism is that decision making isn’t as rational as AIDA suggests because emotions play a much stronger part than AIDA allows. I’d also add – without a shred of empirical proof, thanks for asking – that B2B decision processes flit among stages in no particular sequence, depending on who asks what questions at any given moment. This randomness is abetted by the Internet, which makes information appropriate to all stages equally accessible on demand. But I suspect the process was always more chaotic than marketers cared to admit.
I’d further argue that buyers’ interests are especially fluid early in the purchase process, which is where marketers are involved. It may be more structured towards the end where salespeople can shepherd buyers through a defined set of stages. No, I don’t have any evidence for this either.
The point is this: if buyers don’t move through a fixed set of stages, then it doesn’t make sense to use lead scoring to determine which stage a buyer is at. Nor, for that matter, does it make sense to structure lead nurturing programs to lead (or follow) buyers from one stage to the next. As I said, heresy.
But any jackass can kick down a barn.** I wouldn't discard the funnel model without offering a better alternative – and by better, I specifically mean more effective at producing productive leads. Here’s my two-part modest proposal:
- within nurture programs, leads should be offered whatever materials they are most likely to select next, based on their recent behavior. This is exactly the same as offering customers the products they are most likely to buy (think Amazon book recommendation or Netflix’s movie suggestions) and it can be based on similar advanced predictive modeling technology. And, just as Amazon and Netflix offer more than one option, nurture programs should also offer several items – within limits, since too many choices can depress response. There’s an important humility in offering choices: it recognizes how poor we are at predicting what people want.
- for lead scoring, the goal is to predict which leads the sales force will like. I chose that word carefully – it’s not a question of whether sales will accept a lead, but whether they’ll decide it’s worth sustained effort. Yes, there could be a “like” button that lets sales rate the leads, but don't be so literal-minded. It would be simpler and more effective to check how much activity sales has invested in the lead within, say, thirty days after they received it. Leads that sales is working are, by definition, leads that sales thinks is worthwhile. Leads they don’t work should never have been sent to them. This approach doesn’t magically solve the problem of connecting marketing leads to sales results, but it’s easier than tying leads to actual revenue.
Of these two proposals, the first one is the more radical since it implies a change in the structure of nurture campaigns. Today, sequential campaigns are the gold standard and complex branching structure are the mark of sophistication. A campaign that just presented the most relevant materials would have a vastly simpler structure – essentially a big loop that kept coming back with more messages, which would only differ in which offers they included. The sophistication would lie in the offer selection, not the campaign logic. Lead scoring's only role would be to run in the background and continuously assess whether a lead is ready to send to sales.
Even this choice-based approach doesn’t fully discard a sequential model. You need something to help decide what kinds of content to create, and the most logical tool is the content matrix that marketers already use to ensure they have content for all personas at all buying stages. But while you’re still cooking a full range of dishes, you’re offering them as a buffet rather than a fixed-course dinner. If a customer wants to eat dessert first, why argue?
______________________________________________________________________________
* Usually attributed to Elias St. Elmo Lewis in 1898, although there is some controversy.
** Sam Rayburn, although I bet he didn't originate it.
Sunday, July 01, 2012
3 Ways to Use Lead Scoring Within Your Marketing Automation Programs
I wrote last week about the difficulty of linking marketing leads to sales results. One reason the topic was on my mind is I’m also thinking a lot these days about lead scoring. The practical use of lead scoring is to decide which leads to pass from marketing automation to sales, or, even more pragmatically, to predict which leads will be accepted by sales.* But the ultimate goal is to identify the leads most likely to generate revenue. Building an accurate scoring model therefore requires an accurate view of how leads and revenue are connected.
For all the reasons I discussed last week, that lead-to-revenue connection is hard to make. This is one reason that most lead scoring projects focus instead on the criteria that salespeople use in judging which leads to accept. The other reason is that salespeople can decide which leads they’ll work on – so giving them what they want, regardless of whether it’s what they really need, is the key to lead scoring being considered a success.
Many companies today have inserted a phone call between marketing automation and the sales department, screening every plausible lead before sending them to actual salespeople. This reduces the need for scoring accuracy because the phone call will clarify whether the lead is sales ready. Since the cost of a missed opportunity is much higher than the cost of a wasted phone call, scoring in this situation must simply find all leads with a reasonable chance of success.
In short, scoring programs face two scenarios:
- for scores that directly determine which leads are sent to sales, accuracy is needed but data on past results (necessary to build a good model) is scarce
- for scores that determine which leads get a screening call, accuracy isn’t very important.
Perhaps this is why so few companies use lead scoring (just 19% in a recent MarketingSherpa study) and why the scoring models tend to be simplistic. Investment in more sophisticated techniques, such as statistically-based predictive models, is rarely worth the cost.
There is, however, another use for lead scoring: assigning leads to stages as they move through the marketing funnel.**
Conceptually, assigning leads to funnel stages is quite different from calculating their probability of making a purchase. A funnel stage is defined by meeting specific criteria such as BANT (budget, authority, need and timing) and engagement (downloading a paper or providing contact information). This is more like a checklist than a numeric score, although items like the number of specified behaviors may be calculated. Still, it's sometimes convenient to use score ranges as stage definitions.
In this context, scoring can be used in three ways.
- assign points to directly to stage criteria. For example, imagine a three-stage funnel of Respondent (replied to an email), Qualified Respondent (meets BANT conditions) and Sales Ready Lead (demonstrates engagement). If the scoring rules give 100 points for a response, 100 points for meeting BANT criteria, and 100 points for demonstrating sufficient engagement, then people with 100 points are Respondents, people with 200 points are Qualified Respondents, and people with 300 points are Sales Ready Leads. This is a common approach, although it’s not much different from applying the same rules to classify leads directly.
- treat the score as a probability estimate of reaching the final goal (sales readiness, sales acceptance, or revenue). Under this approach, a Respondent might be someone with a goal probability of under 10%; a Qualified Respondent might have a goal probability of 10% to 50%, and Sales Ready Lead might have a goal probability above 50%. This method avoids the need to define specific lead stage criteria, replacing them with objective predictive modeling methods that are likely to be more accurate.
- treat the score as a probability estimate of reaching the next stage (Respondent, Qualified Respondent, etc.). This retains the explicit stage criteria, which may help marketers visualize who is in each stage and how best to treat them. The predictive model provides additional segmentation within each stage, so marketers can focus their efforts on the most promising leads. Since linking leads to stage movement is easier than linking them to revenue, these predictive models are easier to build.
Today, most companies probably do a hybrid of the first and second options. That is, they assign points based on specified criteria (first option) but assign stages based on point ranges (second option). This combines the familiarity of criteria-based scoring rules with the convenience of numerical stage definitions, making it the easiest method available. But it is also doubly arbitrary, since neither the point values nor the range boundaries can be measured against an objective standard.
I’d suggest that marketers move towards a purer version of the second method, building statistical models that predict the final goal (revenue if available; sales acceptance or sales-ready lead criteria if not). Stage definitions can be arbitrary ranges but correlated against existing stage criteria. Eventually, marketers may want to move toward the third method, with separate models for each stage. This makes it easier to focus on advancing leads from one stage to the next while retaining the rigor of a statistically based approach.
______________________________________________________________________________
* For example, Marketo’s Definitive Guide to Lead Scoring defines lead scoring as “a shared sales and marketing methodology for ranking leads in order to determine their sales-readiness.”
**Eloqua’s Grande Guide to Lead Scoring puts it nicely: lead scoring “helps marketing and sales professionals identify where each prospect is in the buying process.”
For all the reasons I discussed last week, that lead-to-revenue connection is hard to make. This is one reason that most lead scoring projects focus instead on the criteria that salespeople use in judging which leads to accept. The other reason is that salespeople can decide which leads they’ll work on – so giving them what they want, regardless of whether it’s what they really need, is the key to lead scoring being considered a success.
Many companies today have inserted a phone call between marketing automation and the sales department, screening every plausible lead before sending them to actual salespeople. This reduces the need for scoring accuracy because the phone call will clarify whether the lead is sales ready. Since the cost of a missed opportunity is much higher than the cost of a wasted phone call, scoring in this situation must simply find all leads with a reasonable chance of success.
In short, scoring programs face two scenarios:
- for scores that directly determine which leads are sent to sales, accuracy is needed but data on past results (necessary to build a good model) is scarce
- for scores that determine which leads get a screening call, accuracy isn’t very important.
Perhaps this is why so few companies use lead scoring (just 19% in a recent MarketingSherpa study) and why the scoring models tend to be simplistic. Investment in more sophisticated techniques, such as statistically-based predictive models, is rarely worth the cost.
There is, however, another use for lead scoring: assigning leads to stages as they move through the marketing funnel.**
Conceptually, assigning leads to funnel stages is quite different from calculating their probability of making a purchase. A funnel stage is defined by meeting specific criteria such as BANT (budget, authority, need and timing) and engagement (downloading a paper or providing contact information). This is more like a checklist than a numeric score, although items like the number of specified behaviors may be calculated. Still, it's sometimes convenient to use score ranges as stage definitions.
In this context, scoring can be used in three ways.
- assign points to directly to stage criteria. For example, imagine a three-stage funnel of Respondent (replied to an email), Qualified Respondent (meets BANT conditions) and Sales Ready Lead (demonstrates engagement). If the scoring rules give 100 points for a response, 100 points for meeting BANT criteria, and 100 points for demonstrating sufficient engagement, then people with 100 points are Respondents, people with 200 points are Qualified Respondents, and people with 300 points are Sales Ready Leads. This is a common approach, although it’s not much different from applying the same rules to classify leads directly.
- treat the score as a probability estimate of reaching the final goal (sales readiness, sales acceptance, or revenue). Under this approach, a Respondent might be someone with a goal probability of under 10%; a Qualified Respondent might have a goal probability of 10% to 50%, and Sales Ready Lead might have a goal probability above 50%. This method avoids the need to define specific lead stage criteria, replacing them with objective predictive modeling methods that are likely to be more accurate.
- treat the score as a probability estimate of reaching the next stage (Respondent, Qualified Respondent, etc.). This retains the explicit stage criteria, which may help marketers visualize who is in each stage and how best to treat them. The predictive model provides additional segmentation within each stage, so marketers can focus their efforts on the most promising leads. Since linking leads to stage movement is easier than linking them to revenue, these predictive models are easier to build.
Today, most companies probably do a hybrid of the first and second options. That is, they assign points based on specified criteria (first option) but assign stages based on point ranges (second option). This combines the familiarity of criteria-based scoring rules with the convenience of numerical stage definitions, making it the easiest method available. But it is also doubly arbitrary, since neither the point values nor the range boundaries can be measured against an objective standard.
I’d suggest that marketers move towards a purer version of the second method, building statistical models that predict the final goal (revenue if available; sales acceptance or sales-ready lead criteria if not). Stage definitions can be arbitrary ranges but correlated against existing stage criteria. Eventually, marketers may want to move toward the third method, with separate models for each stage. This makes it easier to focus on advancing leads from one stage to the next while retaining the rigor of a statistically based approach.
______________________________________________________________________________
* For example, Marketo’s Definitive Guide to Lead Scoring defines lead scoring as “a shared sales and marketing methodology for ranking leads in order to determine their sales-readiness.”
**Eloqua’s Grande Guide to Lead Scoring puts it nicely: lead scoring “helps marketing and sales professionals identify where each prospect is in the buying process.”
Wednesday, June 27, 2012
Dell To Resell Pardot Marketing Automation
Dell announced today that it has added Pardot marketing automation to its list of Dell Cloud Business Software applications. Other products in the suite include Salesforce.com for sales automation and customer service, Adobe EchoSign for e-signatures, AppExtremes Conga Composer for proposal creation, Dell’s own Boomi for application integration, and a Dell-built analytics platform. That is some pretty good company to keep.
Beyond the Pardot system itself, the Dell offering includes pre-built integration with the other Dell products and with Microsoft Dynamics CRM, and fixed-price implementation packages (from free to $5,000) including training, campaign development, site search setup, CRM integration, and Google AdWords integration. The Pardot system costs from $1,000 to $3,000 per month depending on the email volume, file size, and numbers of forms, landing pages, programs, and automation rules. This is the same as Pardot’s direct-sold prices. Dell also offers a 30 day free trial of Pardot.
The details of the deal are probably less important than its potential for market penetration. Dell hasn’t been on my list of potential entrants into the marketing automation space, but it certainly has a huge presence among small and mid-size businesses. This gives it the capability to add thousands of clients to Pardot’s existing base, which has just recently passed 1,000. Like Intuit’s acquisition last month of local marketing vendor Demandforce, a well-executed rollout could quickly establish a firm whose market share dwarfs existing competitors. In some ways, the Dell/Pardot deal is even more interesting than Intuit/Demandforce, because it touches the small to mid-size businesses that form the core of the B2B marketing automation client base. Intuit/Demandforce will serve many micro-businesses, while other recent deals (FICO/Entiera and Experian/Conversen) are aimed at larger, business-to-consumer marketers.
This doesn't mean an effective Dell/Pardot rollout is guaranteed. These sorts of relationships often fizzle quickly, typically because the larger company’s sales force can’t be bothered to sell the new partner’s product. That seems a bit less likely to happen in this case, since Dell’s cloud business group offers just a handful of applications and Dell has traditionally been a very effective marketer – although its recent performance has been spotty.
Whatever the result of this particular deal, it is more evidence that the B2B marketing automation industry is rapidly approaching consolidation. As deep-pocketed outside companies become active, they battle each other on a grand scale and little firms get crushed almost accidentally. It may be some time before a single victor emerges – if ever – but it’s hard to imagine many of today’s small companies remaining successful as elephants stampede all around them.
Tuesday, June 26, 2012
3 Ways to Connect Marketing Activity to Revenue
Discussions of revenue attribution often remind me of the famous recipe* that begins “First, catch your hare”. Specifically, they assume that marketers know which marketing-generated lead is associated with each bit of revenue, and then go on like medieval theologians to debate how credit should be shared among promotions to that lead. The missing hare is that marketers often can’t link leads to revenue in the first place.
The issues will be painfully familiar to anyone who’s ever tried this. For those who haven’t, let’s start with the mechanics. In most configurations, leads are created in marketing automation and later transferred to Sales, which creates an opportunity that eventually becomes a closed sale with revenue attached. If all goes smoothly, the original marketing campaign and marketing-generated lead are named on the opportunity to provide the lead-to-revenue connection.
But – spoiler alert! – things don’t always go smoothly. When Sales creates the opportunity, it often links it to a contact record other than the original marketing lead. Perhaps the salesperson was already working with someone else, perhaps the marketing lead wasn’t the real decision maker, or perhaps Sales just doesn’t want to give acknowledge Marketing’s contribution. The original marketing campaign is often lost for similar reasons.
All those beautiful attribution recipes are moot if you don’t know which lead is linked to which revenue. So let’s put down the cooking pots and go hare hunting.
The first approach is simply to get Sales to retain the marketing information when it creates the opportunity. Let’s not dismiss this out of hand – yes, salespeople can be uncooperative, but appropriate training and management support can convince them it’s important to retain the information. So it’s worth a try.
But let’s say you don’t have time to wait for better data or can’t get Sales to do what you need. Now you’ll need to work a bit harder with the data on hand.
One approach is to look for matches at the account level: build a list of marketing-generated leads, find the accounts associated with them, find the revenues associated with those accounts, and assume there’s a connection. This could hugely overstate marketing-related revenue, since it potentially takes credit for sales that had nothing to do with marketing activity. So you’ll probably want to put some parameters on the matches such as only including accounts with no pre-existing contacts, leads that Sales followed up on, and opportunities created soon after the marketing lead was submitted. Setting these rules may take some serious discussion between Sales and Marketing, but that’s a good thing.
Unfortunately, there’s no guarantee that Sales will retain the leads sent by marketing or attach them to the correct accounts. Nor is it certain that the companies listed in the marketing automation system will match the accounts listed by Sales. In this case, you may need to build an even looser relationship, looking at company names in both systems – or even ignoring the Sales system altogether and taking data from accounting records. Because the same company may be listed differently in different systems, this sort of matching requires either knowledgeable people or comprehensive reference databases that can make the non-obvious connections. Fortunately, this is a well understood problem and plenty of resources are available to help.
Company-to-company matching casts an even wider net than lead-to-account matching, so it’s correspondingly harder to give marketing credit for every connection. But you can rate how likely it was that marketing played a role in a given opportunity by looking at factors like timing, pre-existing relationships, and amount of marketing activity. This could translate into allocating a fraction of the revenue to marketing, ultimately a more realistic, if less satisfying, approach than taking full credit for some deals and no credit for others.
If fractional allocation strikes you as too complicated, you can also start with a much simpler question: did companies that interacted with marketing programs show more sales than similar companies that didn’t interact with marketing programs? You won’t be able to prove that any particular contact generated any particular deal, but a strong correlation between marketing programs and revenue growth is good evidence that marketing had an impact. Once you’ve captured that hare, you can think about the details of how you’ll cook it.
__________________________________________________________________________
*Jugged Hare in Hannah Grasse’s The Art of Cookery Made Plain and Easy, although it apparently doesn’t include the “catch your hare” part.
Tuesday, June 05, 2012
Salesforce.com and Oracle Buy Social Marketing Systems: Not the End of Marketing As We Know It
Salesforce.com yesterday announced agreement to buy social media publishing vendor Buddy Media for $689 million, thereby adding another big fluffy piece to its “marketing cloud”. Oracle followed suit this morning with an acquisition of social media monitoring and semantic analysis vendor Collective Intellect. This followed Oracle’s $300 million acquisition last month of social publishing system Vitrue. Just for symmetry, it’s worth pointing out that Salesforce.com acquired its own social monitoring system, Radian6, in March 2011.
What are marketers to make of all this activity, not to mention Marketo’s acquisition in April of social marketing vendor Cloud Factory? Is this the death of marketing as we know it?
In a word, no. Social media are certainly a new way to hear what buyers are saying and send them marketing messages. But only the most besotted booster would argue that it will replace, rather than supplement, traditional methods. Every serious marketer already recognizes this, so I’m not even being boldly contrarian by saying it out loud.
The more interesting question is whether social media can be the foundation of a company’s marketing infrastructure. Both Marketo and Oracle already offer robust marketing platforms, so they presumably see social media as a supplement rather than a replacement. (It’s possible that Marketo hopes to reinvent itself as a social media specialist, which is surely more attractive to investors than marketing automation. The key positions taken by Cloud Factory executives might even support the theory. But Marketo hasn’t hinted at this approach.)
Salesforce.com is another story. They’ve always avoided traditional marketing automation, so perhaps they feel a complete “marketing cloud” can be built without it.
The gaps in this approach are obvious to anyone familiar with standard marketing automation systems: no Web behavior tracking, no multi-step nurture campaigns, no marketing resource management. But Salesforce.com could close those gaps by gradually extending its existing products. This might actually be easier than acquiring a separate marketing automation system and shoe horning it into other Salesforce.com components.
One thing I don’t see is social media systems themselves expanding to be marketing automation platforms. So far as I know, the data structures within the social media systems are simple contact profiles – little more than flat files – which can’t easily be extended to store and analyze detailed activity histories across multiple channels. Nor does a standard social media publishing or monitoring platform have the multi-step, branching campaign flows that are the heart of marketing automation. It’s probably easier to add social marketing functions to a marketing automation platform than the other way around. Indeed, many marketing automation vendors have already started.
So, back to the original question: what do these acquisitions mean? I’d say they’re good news for marketers, who will increasingly find social marketing functions available within core marketing platforms, ending the need to integrate separate products. The acquisitions are more problematic for marketing automation vendors, who now need to build, buy, or connect with social marketing systems to remain competitive. This will make it still harder for smaller vendors to compete, hastening the industry consolidation we all know is coming anyway. Nothing boldly contrarian about that prediction either, but it’s still worth bearing in mind.
What are marketers to make of all this activity, not to mention Marketo’s acquisition in April of social marketing vendor Cloud Factory? Is this the death of marketing as we know it?
In a word, no. Social media are certainly a new way to hear what buyers are saying and send them marketing messages. But only the most besotted booster would argue that it will replace, rather than supplement, traditional methods. Every serious marketer already recognizes this, so I’m not even being boldly contrarian by saying it out loud.
The more interesting question is whether social media can be the foundation of a company’s marketing infrastructure. Both Marketo and Oracle already offer robust marketing platforms, so they presumably see social media as a supplement rather than a replacement. (It’s possible that Marketo hopes to reinvent itself as a social media specialist, which is surely more attractive to investors than marketing automation. The key positions taken by Cloud Factory executives might even support the theory. But Marketo hasn’t hinted at this approach.)
Salesforce.com is another story. They’ve always avoided traditional marketing automation, so perhaps they feel a complete “marketing cloud” can be built without it.
The gaps in this approach are obvious to anyone familiar with standard marketing automation systems: no Web behavior tracking, no multi-step nurture campaigns, no marketing resource management. But Salesforce.com could close those gaps by gradually extending its existing products. This might actually be easier than acquiring a separate marketing automation system and shoe horning it into other Salesforce.com components.
One thing I don’t see is social media systems themselves expanding to be marketing automation platforms. So far as I know, the data structures within the social media systems are simple contact profiles – little more than flat files – which can’t easily be extended to store and analyze detailed activity histories across multiple channels. Nor does a standard social media publishing or monitoring platform have the multi-step, branching campaign flows that are the heart of marketing automation. It’s probably easier to add social marketing functions to a marketing automation platform than the other way around. Indeed, many marketing automation vendors have already started.
So, back to the original question: what do these acquisitions mean? I’d say they’re good news for marketers, who will increasingly find social marketing functions available within core marketing platforms, ending the need to integrate separate products. The acquisitions are more problematic for marketing automation vendors, who now need to build, buy, or connect with social marketing systems to remain competitive. This will make it still harder for smaller vendors to compete, hastening the industry consolidation we all know is coming anyway. Nothing boldly contrarian about that prediction either, but it’s still worth bearing in mind.
Monday, June 04, 2012
Social and Mobile Features Head the List of New Marketing Automation Capabilities
I’m getting ready for the next edition of the B2B Marketing Automation Vendor Selection Tool (VEST). This is based on nearly 200 questions to vendors, mostly about product features. The first step in the process is to update the list of questions. This is based on a review of recent vendor announcements plus my own feeling for what’s important. What emerges is an interesting portrait of industry trends in product development.
You won’t be surprised to learn that most of the changes involve social and mobile marketing, today's two hottest areas in marketing in general. We’ll get back to those in a bit. But first, I’d argue the single most important result is just how few changes there really were. B2B marketing automation is far from mature in terms of market penetration, but the mix of product features is pretty well set. Most of vendor announcements I reviewed were about common features that particular vendors had been lacking or were enhancing. Social and mobile are the exceptions, but both are still very small contributors to most B2B marketing programs. I saw much more activity around features that were new last year, such as dynamic content and integration with Webinar systems and with Microsoft Dynamics CRM.
So exactly what new social and mobile features are now on my list? The previous report already included basic social capabilities including sharing marketing content to social media, tracking responses generated from social media, and monitoring social media activity. The new VEST expands that list to include:
- track social media influence: individual-level tracking mechanism that can identify the number of times a recipient has shared a promotion to social media and the number of responses generated the shared promotions. This information is part of the contact profile of the individual.
- create social media posts: deliver messages through social media, such as Twitter posts and Facebook updates. These messages can be created and then scheduled for future delivery.
- create social forms: create forms that are delivered within a third-party social media system such as Facebook.
- create social promotions: create social promotions such as contests, polls, ratings, etc.
- social sign-on and data capture: recipients can register using third-party social credentials, such as their Facebook ID. This gives access to information stored within the third-party social media system and allows communication through that system.
- build social profile: capture information about a specified individual by searching public information across multiple social media systems. This information includes social media handles and social activity such as posts, comments, and questions answered. The information is added to the individual profile and activity history.
The broad range of these features represents both a maturation of B2B social marketing and uncertainty about what will ultimately prove useful. We can expect more social features in the near future, although I suspect some will later be abandoned when it turns out they’re not especially effective in a B2B context.
On to mobile. My previous list of mobile features was limited to text messaging. I’ve expanded that to add:
- mobile formats: generate Web and email versions in formats tailored to delivery on mobile devices such as smartphones and tablets.
- mobile CRM: salespeople can access the system on mobile platforms such as smartphones and tablets.
- mobile reporting: users can access reports on mobile platforms such as smartphones and tablets.
- mobile administration: users can set up campaigns and create content on mobile platforms such as smartphones and tablets.
Only the first of these, mobile formats, is about delivering marketing messages. The others are all about marketers and salespeople accessing the system on their own mobile devices. That’s clearly the current focus on mobile marketing automation, although it’s safe to expect more mobile marketing in the future – such as location-based promotions, which are notably absent so far.
I also added three entries in other categories. These were:
- app marketplace: the vendor has a formal app marketplace that lets third party applications connect to its product without custom integration.
- real time recommendations: rules and/or predictive models can recommend the best treatment for a customer as an interaction takes place within system-managed content such as a Web page.
- real time interactions: rules and/or predictive models can recommend the best treatment for a customer as an interaction takes place within an external platform such as a call center or Web site. This requires features to collect information about the interaction from the external platform, to match this information against the system's own database of contacts profiles and history, to make recommendation using the available information, and to deliver the recommendation to the external platform. .
These features all expand the scope of B2B marketing automation, mostly be connecting it with other systems. In one sense that's the opposite of the previous new entries, which were about adding features to marketing automation itself. But both approaches aim to place marketing automation at the center of a company’s customer management infrastructure. Since other products, including CRM and Web sites, are also reaching for that position, we’ll see how widely these features get adopted. My sense is they’ll be more successful at small companies, where the labor savings of a unified system are most important because technology resources are most constrained.
None of the features I’ve added are currently available in more than a handful of systems. Some may not yet be present in any. Few marketers this year will choose a system primarily because these particular features are present. But we'll find over time which are really important.
You won’t be surprised to learn that most of the changes involve social and mobile marketing, today's two hottest areas in marketing in general. We’ll get back to those in a bit. But first, I’d argue the single most important result is just how few changes there really were. B2B marketing automation is far from mature in terms of market penetration, but the mix of product features is pretty well set. Most of vendor announcements I reviewed were about common features that particular vendors had been lacking or were enhancing. Social and mobile are the exceptions, but both are still very small contributors to most B2B marketing programs. I saw much more activity around features that were new last year, such as dynamic content and integration with Webinar systems and with Microsoft Dynamics CRM.
So exactly what new social and mobile features are now on my list? The previous report already included basic social capabilities including sharing marketing content to social media, tracking responses generated from social media, and monitoring social media activity. The new VEST expands that list to include:
- track social media influence: individual-level tracking mechanism that can identify the number of times a recipient has shared a promotion to social media and the number of responses generated the shared promotions. This information is part of the contact profile of the individual.
- create social media posts: deliver messages through social media, such as Twitter posts and Facebook updates. These messages can be created and then scheduled for future delivery.
- create social forms: create forms that are delivered within a third-party social media system such as Facebook.
- create social promotions: create social promotions such as contests, polls, ratings, etc.
- social sign-on and data capture: recipients can register using third-party social credentials, such as their Facebook ID. This gives access to information stored within the third-party social media system and allows communication through that system.
- build social profile: capture information about a specified individual by searching public information across multiple social media systems. This information includes social media handles and social activity such as posts, comments, and questions answered. The information is added to the individual profile and activity history.
The broad range of these features represents both a maturation of B2B social marketing and uncertainty about what will ultimately prove useful. We can expect more social features in the near future, although I suspect some will later be abandoned when it turns out they’re not especially effective in a B2B context.
On to mobile. My previous list of mobile features was limited to text messaging. I’ve expanded that to add:
- mobile formats: generate Web and email versions in formats tailored to delivery on mobile devices such as smartphones and tablets.
- mobile CRM: salespeople can access the system on mobile platforms such as smartphones and tablets.
- mobile reporting: users can access reports on mobile platforms such as smartphones and tablets.
- mobile administration: users can set up campaigns and create content on mobile platforms such as smartphones and tablets.
Only the first of these, mobile formats, is about delivering marketing messages. The others are all about marketers and salespeople accessing the system on their own mobile devices. That’s clearly the current focus on mobile marketing automation, although it’s safe to expect more mobile marketing in the future – such as location-based promotions, which are notably absent so far.
I also added three entries in other categories. These were:
- app marketplace: the vendor has a formal app marketplace that lets third party applications connect to its product without custom integration.
- real time recommendations: rules and/or predictive models can recommend the best treatment for a customer as an interaction takes place within system-managed content such as a Web page.
- real time interactions: rules and/or predictive models can recommend the best treatment for a customer as an interaction takes place within an external platform such as a call center or Web site. This requires features to collect information about the interaction from the external platform, to match this information against the system's own database of contacts profiles and history, to make recommendation using the available information, and to deliver the recommendation to the external platform. .
These features all expand the scope of B2B marketing automation, mostly be connecting it with other systems. In one sense that's the opposite of the previous new entries, which were about adding features to marketing automation itself. But both approaches aim to place marketing automation at the center of a company’s customer management infrastructure. Since other products, including CRM and Web sites, are also reaching for that position, we’ll see how widely these features get adopted. My sense is they’ll be more successful at small companies, where the labor savings of a unified system are most important because technology resources are most constrained.
None of the features I’ve added are currently available in more than a handful of systems. Some may not yet be present in any. Few marketers this year will choose a system primarily because these particular features are present. But we'll find over time which are really important.
Subscribe to:
Posts (Atom)