The fourth and final item I had planned to add to the Demand Generation Guide Web site was posted yesterday. This is a spreadsheet on calculating the business value of a demand generation system. Basically it defines a formula for calculating profit based on factors that are affected by a demand generation system: number of leads, lead-to-customer conversion rate, net margin per customer, acquisition cost, lead handling cost and sales cost. It then identifies which factors are affected by different demand generation applications (lead generation campaigns, lead nuturing campaigns, lead distribution, reporting). These are set out on a spreadsheet so users can enter the current values and then make changes to reflect gains expected from the demand generation system. The system calculates profits from both sets of figures and shows the difference, which is the value of the new system.
Nothing fancy about all that, but bringing it down to the different applications adds a note of reality to the usual "pull numbers of thin air" approach, I think.
The business case worksheet and other articles are available for free at www.raabguide.com.
Friday, October 31, 2008
Monday, October 27, 2008
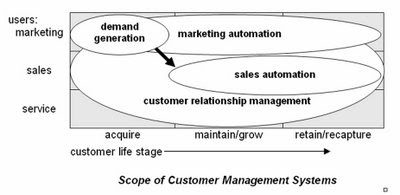
Demand Gen vs. CRM Paper Now Available
Over the weekend I completed "Demand Generation vs. Customer Relationship Management", the third in my trio of papers explaining where demand generation systems fit into the larger world of customer management software. Like the other two, they are available at the Raab Guide to Demand Generation Systems Web site http://www.raabguide.com/. This one was much easier to write because I was able to draw on the six-task framework established in the first of the trio, "Introduction to Demand Generation Systems". It's all good stuff, in my humble and unbiased opinion. Do take a look.
While writing the new paper I slightly revised the scope diagram I published last week. The new one is below. Changes are subtle--a two-headed arrow and showing some slight overlap between demand generation and sales automation.

Thursday, October 23, 2008
Demand Generation Overview
As I promised (threatened?) in my last post, I've been furiously writing articles to explain demand generation for the new Guide Web site. I just finished #2, the not-very-creatively titled "Introduction to Demand Generation Systems" and posted it there.
I won't recap the piece in detail, but am pleased that it does contain pictures. One illustrates my conception of how demand generation systems fit into the world of marketing systems, as follows:
Is that cute or what?
The others are a pair of flow charts illustrating four tasks within the lead managgement cycle...

... and then how those fit into the larger marketing management process:

Anyway, you probably knew all that. But I do like the pictures.
Monday, October 20, 2008
Marketing Automation vs. Demand Generation: What's the Difference?
One of the first people I told about the new Guide to Demand Generation Systems -- an experienced database marketing consultant, no less -- was receptive to the Guide but asked whether there was any real difference between "demand generation" and "marketing automation" in general. This set off all kinds of alarms, since this was someone who clearly should have been familiar with the distinction.
As with most things, my immediate reaction was to write up an answer. In fact, I've decided I need at least three pieces on the topic: one explaining demand generation in general; one explaining how it differs from marketing automation; and another distinguishing it from customer relationship management (CRM). All this is on top of the piece I was in the middle of writing, on how to cost-justify a demand generation system. These are all fodder for the "Downloadable Resources" section of the new Guide site (have I mentioned in this paragraph that it's http://www.raabguide.com/?), which was looking pretty threadbare at just two pieces.
Anyway, the piece comparing demand generation vs. marketing automation is just finished and posted you-know-where. The short answer is demand generation systems serve marketers who are focused on the lead acquisition and nurturing portion of the customer life cycle, while marketing automation systems serve marketers who are responsible for managing the entire life cycle: acquisition, maintenance and retention. I suspect this distinction will not be popular among some of you, who will correctly point out that demand generation systems can be and are sometimes used for on-going customer management programs. True enough, but I'd still say the primary focus and competitive advantage of demand generation systems is in the pre-customer stage. One big reason demand generation systems aren't really suited for cradle-to-grave customer management: they don't typically capture the sales and service transactions needed to properly target customer communications.
By all means, download the full paper from http://www.raabguide.com/ and let me know your thoughts.
Wednesday, October 15, 2008
Department of the Obvious: Anti-Terrorist Data Mining Doesn't Work
I've emerged from the cave where Osama bin Laden and I were working on the new Guide to Demand Generation Systems (oops -- the Osama part was supposed to be secret) and am now catching up with the rest of the world. One news item that caught my attention described a recent National Research Council report that concluded data mining to find terrorists "is neither feasible as an objective nor desirable as a goal of technology development efforts." See "Government report: data mining doesn't work well" from CNET.
The article pretty much speaks for itself and is no surprise to anyone who is even remotely familiar with the actual capabilities of the underlying technology. Sady, this group is a tiny minority while the rest of the world bases its notions of what's possible on movies like Minority Report and Enemy of the State, and TV shows like 24. (Actually, I've never seen 24, so I don't really know what claims it makes for technology.) So even though this is outside the normal range of topics for this blog, it's worth publicizing a bit in the hopes of stimulating a more informed public conversation.
The article pretty much speaks for itself and is no surprise to anyone who is even remotely familiar with the actual capabilities of the underlying technology. Sady, this group is a tiny minority while the rest of the world bases its notions of what's possible on movies like Minority Report and Enemy of the State, and TV shows like 24. (Actually, I've never seen 24, so I don't really know what claims it makes for technology.) So even though this is outside the normal range of topics for this blog, it's worth publicizing a bit in the hopes of stimulating a more informed public conversation.
Tuesday, October 14, 2008
Sample Guide Entries Now Available on the New Site
The new Guide Web site is now fully functional at www.raabguide.com. Please visit and comment. If you want to make a purchase, even better.
Per yesterday's post regarding the comparison matrix and vendor tables, extracts of both are available on the site (under 'Look Inside' on the 'Guide' page). These will give a concrete view of the difference between the two formats.
I'm sure I'll be adding more to the site over time. For the moment, we have to turn our attention to marketing: press release should have gone out today but I haven't heard from the person working on it. Tomorrow, perhaps.
Monday, October 13, 2008
Free Usability Assessment Worksheet!
I won’t claim a direct cause-and-effect relationship, but is it really just a coincidence that the stock market finally had a good day exactly when my new Guide to Demand Generation Systems is about to be released? Think about it.
That said, the new Guide Web site is in the final testing and should be launched tomorrow. It might even be working by the time you read this: try http://www.raabguide.com/. The Guide itself has been circulating in draft among the vendors for about two weeks. The extra time was helpful since it allowed a final round of corrections triggered by the yes/no/maybe comparison matrix.
I still feel this sort of matrix oversimplifies matters, but it does seem to focus vendors’ attention in a way that less structured descriptions do not. In fact, I’m wondering whether I should drop the structured descriptions altogether, and just show the matrix categories with little explanatory notes. Readers would lose some nuance, but if nobody pays attention to the descriptions anyway, it might be a good choice for future editions. It would certainly save me a fair amount of work. Thoughts on the topic are welcome (yes, I know few of you have actually seen the Guide yet. I’m still considering how to distribute samples without losing sales.)
Part of my preparation for the release has been to once more ponder the question of usability, which is central to the appeal of several Guide vendors. A little external research quickly drove home the point that usability is always based on context: it can only be measured for particular users for particular functions in particular situations. This was already reflected in my thinking, but focusing on it did clarify matters. It actually implies two important things:
1. each usability analysis has to start with a definition of the specific functions, users and conditions that apply to the purchasing organization. This, in turn, means
2. there’s no way to create a generic usability ranking.
Okay, I’ll admit #2 is a conclusion I’m very happy to reach. Still, I do think it’s legitimate. More important, it opens a clear path towards a usability assessment methodology. The steps are:
- define the functions you need, the types of users who perform each function, and the conditions the users will work under. “Types of users” vary by familiarity with the system, how often they use it, their administrative rights, and their general skill sets (e.g. marketers vs. analysts vs. IT specialists). The effort required for a given task varies greatly for different user types, and so do the system features that are most helpful. To put it in highway terms: casual users need directions and guardrails; experienced users like short cuts.
“Conditions” are variables like the time available for a task, the number of tasks to complete, the cost of making an error, and external demands on the user’s time. A system that’s optimized for one set of conditions might be quite inefficient under another set. For example, a system designed to avoid errors through careful review and approvals of new programs might be very cumbersome for users who don’t need that much control.
- assess the effort that the actual users will spend on the functions. The point is that having a specific type of user and set of conditions in mind makes it much easier to assess a system’s suitability. Ideally, you would estimate the actual hours per year for each user group for each task (recognizing that some tasks may be divided among different user types). But even if you don't have that much detail, you should still be able to come up with a score that reflects which systems are more easier to use in a particular situation.
- if you want to get really detailed, break apart the effort associated with each task into three components: training, set-up (e.g. a new email template or campaign structure), and execution (e.g. customizing an email for a particular campaign). This is the most likely way for labor to be divided: more skilled users or administrators will set things up, while casual users or marketers will handle day-to-day execution. This division also matches important differences among the systems themselves: some require more set-up but make incremental execution very easy, while others need less set-up for each project but allow less reuse. It may be hard to actually uncover these differences in a brief vendor demonstration, but this approach at least raises the right question and gives a framework for capturing the answers.
- after the data is gathered, summarize it in a traditional score card fashion. If the effort measures are based on hours per year, no weighting is required; if you used some other type of scoring system, weights may be needed. You can use the same function list for traditional functionality assessments, which boil down to the percentage of requirements (essential and nice-to-have) each system can meet. Functional scores almost always need to be weighted by importance. Once you have functionality and usability scores available, comparing different systems is easy.
In practice, as I’ve said so many times before, the summary scores are less important than the function-by-function assessments going into them. This is really where you see the differences between systems and decide which trade-offs make the most sense.
For those of you who are interested, I’ve put together a Usability Assessment Worksheet that supports this methodology. This is available for free on the new Guide Web site: just register (if registration is working yet) and you’ll be able to download it. I’ll be adding other resources over time as well—hopefully the site will evolve into a useful repository of tools.
Wednesday, October 01, 2008
New Guide is Ready
I've been distracted this week by an unrelated client deadline, but the new Raab Guide to Demand Generation Systems is indeed complete. A proper e-commerce site will be available shortly, but if anyone really can't wait, the salient details are:
- 150+ point comparison matrix and detailed tables on: Eloqua, Manticore, Marketo, Market2Lead and Vtrenz, based on extensive vendor interviews and demonstrations
- price: $595 for single copy, $995 for one-year subscription (provides access to updates as these are made--I expect to add more vendors and update entries on current ones).
- to order in the next few days, contact me via email at draab@raabassociates.com
More details to follow....
Friday, September 05, 2008
More Thoughts on Comparing Demand Generation Systems
I have mostly been focused this week on formats for the new Demand Generation Guide. Since this is of interest to at least some regular readers of this blog, I suppose it’s okay to give you all an update.
The issue I’m wresting with is still how to present vendor summaries. As of last week’s post, I had decided to build a list of applications plus some common issues such as vendor background, technology and pricing. Ease of use was still a nagging issue because ease of use for simple tasks can conflict with ease of use for complex ones.
The only way to resolve this, for me at least, was to actually create a draft entry and see how things played out. This is what I’ve been doing and it has been quite enlightening. What I’ve found is that I can identify a smaller set of applications, and then classify features as applying to simple (basic) forms of those applications, or complex (advanced) ones. I can make a similar basic/advanced distinction for the non-application features (vendor, technology, etc.), which I think I’ll christen as “foundations” for the sake of parallelism. (They also rhyme, in case anybody ever wants to write the song.)
So what I end up with is a two-column matrix that has ‘basic’ and ‘advanced’ as the columns, and horizontal sections for four applications (lead generation, lead nurturing, lead scoring and distribution, and performance measruement) and four foundations (technology, vendor, usability, pricing). Each horizontal section contains multiple rows, where each row lists a specific item such as “import HTML for Web pages” or “a/b testing”. When I looked at the various items of information I have been gathering, it was pretty easy to determine where in this matrix each item belonged. My current version of the matrix has about 140 items altogether, a number that will increase but probably not by much.
Most of these items are pretty close to binary—that is, a system either does it or not. Of course, there are still shades of gray, such as future features or partial implementations. So I’ve chosen a three point scale that boils down to yes, no and kinda. This is precise enough for the purpose at hand.
What I like about this approach is that it gives pretty clear guidance to users who have basic vs. advanced needs for any particular application or foundation. It doesn’t require me to make any particular assumption about who those people are—i.e., that small firms are unsophisticated or big firms have advanced needs. And it lets people mix and match their priorities: somebody might want advanced lead generation but just basic performance measurement.
Careful readers (you know who you are) will have noted that my scheme has transmuted “ease of use” into “usability”. That foundation includes implementation and support services as well as traditional ease of use items of required user skills, steps to complete a process, and marketing asset reusability. These are admittedly more subjective than most of other items in the matrix, but still seem like a step in the right direction. At least I now have a framework that can hold additional, more precise items as I come up with them.
The other big outstanding issue is how to combine the items into summary scores. At present I’m simply adding up the points and calculating a percentage of actual vs. potential points in each category. This doesn’t address the fact that some items are more important than others. Of course, the proper treatment is to assign weights to each item. I may assign those weights myself, or I may just leave that up to Guide readers. Similarly, a single vendor-level score would require assigning weights to the application and foundation categories themselves so their scores can be combined. Here, it’s clearer that each company should assign its own weights—in fact, this weighting is an important part of the decision-making process, so it’s quite important that users do it. But I may assign default weights anyway, because I know people will ask for them, or create different weights for different scenarios. Fortunately, I don’t have to make that decision for a while.
Incidentally, I am not being coy in mentioning the matrix without publishing the details. As much as anything, I’m deterred by the fact that I still haven’t figured out how to load the table into Blogger so it will display properly. (Yes, I do know how to hand code a table in HTML. But I get funky results when I try and haven’t had time to fiddle with it. The HTML that Excel generates automatically won’t work at all.) Once I finalize the matrix itself, I’ll probably include it in a blog post or make it available for download.
Thursday, August 28, 2008
Comparing Demand Generation Systems
Now that I have that long post about analytical databases out of the way, I can get back to thinking about demand generation systems. Research on the new Guide is proceeding nicely (thanks for asking), and should be wrapped up by the end of next week. This means I have to nail down how I’ll present the results. In my last post on the topic, I was thinking in terms of defining user types. But, as I think I wrote in a comment since then, I now believe the best approach is to define several applications and score the vendors in terms of their suitability for each. This is a pretty common method for serious technology evaluations.
Ah, but what applications? I’ve tentatively come up with the following list. Please let me know if you would suggest any changes.
- Outbound campaigns: generate mass emails to internal or imported lists and manage responses. Key functions include list segmentation, landing pages, response tracking, and response handling. May include channels such as direct mail, call center, and online chat.
- Automated followup: automatically respond to inquiries. Key functions include landing pages, data capture surveys, and trigger-based personalized email.
- Lead nurturing: execute repeated contacts with leads over time. Key functions include multi-step campaigns, offer selection, email and newsletters, landing pages, and response tracking.
- Score and distribute leads: assess leads and distribute them to sales when appropriate. Key functions including lead scoring, surveys, data enhancement, lead assignment, and CRM integration.
- Localized marketing: coordinate efforts by marketing groups for different product lines or geographic regions. Key functions include shared marketing contents, templates, version control, campaign calendars, asset usage reports, and fine-grained security.
- Performance tracking: assess the value of different marketing programs, including those managed outside the demand generation system. Key functions include response capture, data imports including revenue from CRM, response attribution, cross-channel customer data integration, and program cost capture.
- Event management: execute marketing events such as Webinars. Key functions include reservations and reminder notices.
There are also some common issues such as ease of use, scalability, cost, implementation, support, and vendor stability. Most of these would be evaluated apart from the specific applications. The one possible exception Is ease of use. The challenge here is the same one I keep running into: systems that are easy to use for simple applications may be hard to use for complex forms of the same application. Maybe I’ll just create separate scores for those two situations—that is, “simple application ease of use” and “advanced application ease of use”. I’ll give this more thought, and look for any comments from anyone else.
Wednesday, August 27, 2008
Looking for Differences in MPP Analytical Databases
“You gotta get a gimmick if you wanna get ahead” sing the strippers in the classic musical Gypsy. The same rule seems to apply to analytical databases: each vendor has its own little twist that makes it unique, if not necessarily better than the competition. This applies even, or maybe especially, to the non-columnar systems that use a massively parallel (“shared-nothing”) architecture to handle very large volumes.
You’ll note I didn’t refer to these systems as “appliances”. Most indeed follow the appliance path pioneered by industry leader Netezza, I’ve been contacted by Aster Data, Microsoft), Dataupia, and Kognitio. A review of my notes shows that no two are quite alike.
Let’s start with Dataupia. CEO and founder Foster Hinshaw was also a founder at Netezza, which he left in 2005. Hinshaw still considers Netezza the “killer machine” for large analytical workloads, but positions Dataupia as a more flexible product that can handle conventional reporting in addition to ad hoc analytics. “A data warehouse for the rest of us” is how he puts it.
As it happens, all the vendors in this group stress their ability to handle “mixed workloads”. It’s not clear they mean the same thing, although the phrase may indicate that data can be stored in structures other than only star/snowflake schemas. In any event, the overlap is large enough that I don’t think we can classify Dataupia as unique on that particular dimension. What does set the system apart is its ability to manage “dynamic aggregation” of inputs into the data cubes required by many business intelligence and reporting applications. Cube building is notoriously time-consuming for conventional databases, and although any MPP database can presumably maintain cubes, it appears that Dataupia is especially good at it. This would indeed support Dataupia’s position as more reporting-oriented than its competitors.
The other apparently unique feature of Dataupia is its ability to connect with applications through common relational databases such as Oracle and DB2. None of the other vendors made a similar claim, but I say this is “apparently” unique because Hinshaw said the connection is made via the federation layer built into the common databases, and I don’t know whether other systems could also connect in the same way. In any case, Hinshaw said this approach makes Dataupia look to Oracle like nothing more than some additional table space. So integration with existing applications can’t get much simpler.
One final point about Dataupia is pricing. A 2 terabyte blade costs $19,500, which includes both hardware and software. (Dataupia is a true appliance.) This is a much lower cost than any competitor.
The other true appliance in this group is DATAllegro. When we spoke in April, it was building its nodes with a combination of EMC storage, Cisco networking, Dell servers, Ingres database and the Linux operating system. Presumably the Microsoft acquisition will change those last two. DATAllegro’s contribution was the software to distribute data across and within the hardware nodes and to manage queries against that data. In my world, this falls under the heading of intelligent partitioning, which is not itself unique: in fact, three of the four vendors listed here do it. Of course, the details vary and DATAllegro’s version no doubt has some features that no one else shares. DATAllegro was also unique in requiring a large (12 terabyte) initial configuration, for close to $500,000. This will also probably change under Microsoft management.
Aster Data lets users select and assemble their own hardware rather than providing an appliance. Otherwise, it generally resembles the Dataupia and DATAllegro appliances in that it uses intelligent partitioning to distribute its data. Aster assigns separate nodes to the tasks of data loading, query management, and data storage/query execution. The vendor says this makes it easy to support different types of workloads by adding the appropriate types of nodes. But DATAllegro also has separate loader nodes, and I’m not sure about the other systems. So I’m not going to call that one unique. Aster pricing starts at $100,000 for the first terabyte.
Kognitio resembles Aster in its ability to use any type of hardware: in fact, a single network can combine dissimilar nodes. A more intriguing difference is that Kogitio is the only one of these systems that distributes incoming data in a round-robin fashion, instead of attempting to put related data on the same node. It can do this without creating excessive inter-node traffic because it loads data into memory during query execution—another unique feature among this group. (The trick is that related data is sent to the same node when it's loaded into memory. See the comments on this post for details.)
Kognitio also wins the prize for the oldest (or, as they probably prefer, most mature) technology in this group, tracing its WX2 product to the WhiteCross analytical database of the early 1980’s. (WX2…WhiteCross…get it?) It also has by far the highest list price, of $180,000 per terabyte. But this is clearly negotiable, especially in the U.S. market, which Kognitio entered just this year. (Note: after this post was originally published, Kognitio called to remind me that a. they will build an appliance for you with commodity hardware if you wish and b. they also offer a hosted solution they call Data as a Service. They also note that the price per terabyte drops when you buy more than one.)
Whew. I should probably offer a prize for anybody who can correctly infer which vendors have which features from the above. But I’ll make it easy for you (with apologies that I still haven’t figured out how to do a proper table within Blogger).
______________Dataupia___DATAllegro___Aster Data___Kognitio
Mixed Workload_____Yes________Yes________Yes________Yes
Intelligent Partition___Yes________Yes________Yes________no
Appliance__________Yes________Yes________no________no
Dynamic Aggregation__Yes________no_________no________no
Federated Access_____Yes________no_________no________no
In-Memory Execution__no________no_________no________Yes
Entry Cost per TB___$10K(1)___~$40K(2)______$100K______$180K
(1) $19.5K for 2TB
(2) under $500K for 12TB; pre-acquisition pricing
As I noted earlier, some of these differences may not really matter in general or for your application in particular. In other cases, the real impact depends on the implementation details not captured in such a simplistic list. So don’t take this list for anything more than it is: an interesting overview of the different choices made by analytical database developers.
Wednesday, August 06, 2008
More on QlikView - Curt Monash Blog
I somehow ended up posting some comments on QlikView technology on Curt Monash's DBMS2 blog. This is actually a more detailed description than I've ever posted here about how I think QlikView works. If you're interested in that sort of thing, do take a look.
Tuesday, August 05, 2008
More on Vertica
I finally had a conversation with columnar database developer Vertica last week. They have done such an excellent job explaining their system in white papers and other published materials that most of my questions had already been answered. But it’s always good to hear things straight from the source.
The briefing pretty much confirmed what I already knew and have written here and elsewhere. Specifically, the two big differentiators of Vertica are its use of sorted data and of shared-nothing (MPP) hardware. Loading the data in a sorted order allows certain queries to run quickly because the system need not scan the entire column to find the desired data. Of course, if a query involves data from more than one column, all those columns be stored in the same sequence or must be joined on a common ID. Vertica supports both approaches. Each has its cost. Shared-nothing hardware allows scalability and allows redundant data storage which simplifies recovery.
Our conversation did highlight a few limits that I hadn’t seen clearly before. It turns out that the original releases of Vertica could only support star and snowflake schema databases. I knew Vertical was star schema friendly but didn’t realize the design was required. If I understood correctly, even the new release will not fully support queries across multiple fact tables sharing a dimension table, a fairly common data warehouse design. Vertica’s position is that everybody really should use star/snowflake designs. The other approaches were compromises imposed the limits of traditional row-oriented database engines, which Vertica makes unnecessary. I suspect there are other reasons people might want to use different designs, if only to save the trouble of transforming their source data.
On a somewhat related note, Vertica also clarified that their automated database designer—a major strength of the system—works by analyzing a set of training queries. This is fine so long as workloads are stable, but not so good if they change. A version that monitors actual queries and automatically adjusts the system to new requirements is planned for later this year. Remember that database design is very important to Vertica, since performance depends in part on having the right sorted columns in place. Note also that the automated design will become trickier as the system supports more than start/snowflake schemas. I wouldn’t be surprised to see some limits on the automated designs as a result.
The other bit of hard fact that emerged from the call is that the largest current production database for Vertica is 10 terabytes. The company says new, bigger installations are added all the time, so I’m sure that number will grow. They added that they’ve tested up to 50 TB and are confident the system will scale much higher. I don’t doubt it, since scalability is one of the key benefits of the shared-nothing approach. Vertica also argues that the amount of data is not a terribly relevant measure of scalability—you have to consider response time and workload as well. True enough. I’d certainly consider Vertica for databases much larger than 10 TB. But I’d also do some serious testing at scale before making a purchase.
Monday, August 04, 2008
Still More on Assessing Demand Generation Systems
I had a very productive conversation on Friday with Fred Yee, president of ActiveConversion, a demand generation system aimed primarily at small business. As you might have guessed from my recent posts, I was especially interested in his perceptions of the purchase process. In fact, this was so interesting that I didn’t look very closely at the ActiveConversion system. This is no reflection on the product, which seems to be well designed, is very reasonably priced, and has a particularly interesting integration with the Jigsaw online business directory to enhance lead information. I don't know when or whether I'll have time to do a proper analysis of ActiveConversion, but if you're in the market, be sure to take a look.
Anyway, back to our talk. If I had to sum up Fred’s observations in a sentence, it would be that knowledgeable buyers look for a system that delivers the desired value with the least amount of user effort. Those buyers still compare features when they look at products, but they choose the features to compare based on the value they are seeking to achieve. This is significantly different from a simple feature comparison, in which the product with the most features wins, regardless of whether those features are important. It differs still further from a deep technical evaluation, which companies sometimes perform when they don’t have a clear idea of how they will actually use the system.
This view is largely consistent with my own thoughts, which of course is why I liked hearing it. I’ll admit that I tend to start with requirements, which are the second step in the chain that runs from value to requirements to features. But it’s always been implied that requirements are driven by value, so it’s no big change for me to explicitly start with value instead.
Similarly, user effort has also been part of my own analysis, but perhaps not as prominent as Fred would make it. He tells me they have purposely left many features out of ActiveConversion to keep it easy. Few vendors would say that—the more common line is that advanced features are present but hidden from people who don’t need them.
Along those lines, I think it’s worth noting that Fred spoke in terms of minimizing the work performed by users, not of making the system simple or easy to use. Although he didn’t make a distinction, I see a meaningful difference: minimizing work implies a providing the minimum functionality needed to deliver value, while simplicity or ease of use implies minimizing user effort across all levels of functionality.
Of course, every vendor tries to make their system as easy as possible, but complicated functions inevitably take more effort. The real issue, I think, is that there are trade-offs: making complicated things easy may make simple things hard. So it's important to assess ease of use in the context of a specific set of functions. That said, some systems are certainly better designed than others, so it's possible to be easier to use for all functions across the board.
Looking back, the original question that kicked off this series of posts was how to classify vendors based on their suitability for different buyers. I’m beginning to think that was the wrong question—you need to measure each vendor against each buyer type, not assign each vendor to a single buyer type. In this case, the two relevant dimensions would be buyer types (=requirements, or possibly values received) on one axis, and suitability on the other. Suitability would include both features and ease of use. The utility of this approach depends on the quality of the suitability scores and, more subtly, on the ability to define useful buyer types. This involves a fair amount of work beyond gathering information about the vendors themselves, but I suppose that’s what it takes to deliver something useful.
Thursday, July 31, 2008
How to Report on Ease of Use?
Yesterday’s post on classifying demand generation systems prompted some strong reactions. The basic issue is how to treat ease of use when describing vendors.
It’s hard to even define the issue without prejudicing the discussion. Are we talking about vendor rankings, vendor comparisons, or vendor analyses?
- Ranking implies a single score for each product. The approach is popular but it leads people to avoid evaluating systems against their own requirements. So I reject it.
- Vendor comparisons give each several scores to each vendor, for multiple categories. I have no problem with this, although it still leaves the question of what the categories should be.
- Vendor analyses attempt to describe what it's like to use a product. This is ultimately what buyers need to know, but it doesn’t lead directly to deciding which product is best for a given company.
Ultimately, then, a vendor comparison is what’s needed. Scoring vendors on several categories will highlight their strengths and weaknesses. Buyers then match these scores against their own requirements, focusing on the areas that are important to them. The mathematically inclined can assign formal weights to the different categories and generate a combined score if they wish. In fact, I do this regularly as a consultant. But the combined scores themselves are actually much less important than the understanding gained of trade-offs between products. Do we prefer a product that is better at function A than function B, or vice versa? Do we accept less functionality in return for lower cost or higher ease of use? Decisions are really made on that basis. The final ranking is just a byproduct.
The question, then, is whether ease of use should be one of the categories in this analysis. In theory I have no problem with including it. Ease of use does, however, pose some practical problems.
- It’s hard to measure. Ease of use is somewhat subjective. Things that are obvious to one person may not be obvious to someone else. Even a concrete measure like the time to set up a program or the number of keystrokes to accomplish a given task often depends on how familiar users are with a given system. This is not to say that usability differences don’t exist or are unmeasurable. But it does mean they are difficult to present accurately.
- ease depends on the situation. The interface that makes it easy to set up a simple project may make it difficult or impossible to handle a more complicated one. Conversely, features that support complex tasks often get in the way when you just want to do something simple. If one system does simple things easily and another does complicated things easily, which gets the better score?
I think this second item suggests that ease of use should be judged in conjunction with individual functions, rather than in general. In fact, it’s already part of a good functional assessment: the real question is usually not whether a system can do something, but how it does it. If the “how” is awkward, this lowers the score. This is precisely why I gather so much detail about the systems I evaluate, because I need to understand that “how”.
This leads me pretty much back to where I started, which is opposed to breaking out ease of use as a separate element in a system comparison. But I do recognize that people care deeply about it, so perhaps it would make sense to assess each function separately in terms of power and ease of use. Or, maybe some functions should be split into things like “simple email campaigns” and “complex email campaigns”. Ease of use would then be built into the score for each of them.
I’m still open to suggestion on this matter. Let me know what you think.
Tuesday, July 29, 2008
How Do You Classify Demand Generation Systems?
I’ve been pondering recently how to classify demand generation systems. Since my ultimate goal is to help potential buyers decide which product to purchase, the obvious approach is to first classify the buyers themselves and then determine which systems best fit which group. Note that while this seems obvious, it’s quite different from how analyst firms like Gartner and Forrester set up their classifications. Their ratings are based on market positions, with categories such as “leaders”, “visionaries”, and “contenders”.
This approach has always bothered me. Even though the analysts explicitly state that buyers should not simply limit their consideration to market “leaders”, that is exactly what many people do. The underlying psychology is simple: people (especially Americans, perhaps) love a contest, and everyone wants to work with a “leader”. Oh, and it’s less work than trying to understand your actual requirements and how well different systems match them.
Did you detect a note of hostility? Indeed. Anointing leaders is popular but it encourages buyers to make bad decisions. This is not quite up there with giving a toddler a gun, since the buyers are responsible adults. But it could, and should, be handled more carefully.
Now I feel better. What was I writing about? Right--classifying demand generation systems.
Clearly one way to classify buyers is based on the size of their company. Like the rich, really big firms are different from you and I. In particular, really big companies are likely to have separate marketing operations in different regions and perhaps for different product lines and customer segments. These offices must work on their own projects but still share plans and materials to coordinate across hundreds of marketing campaigns. They need fine-grained security so the groups don't accidentally change each other's work. Large firms may also demand an on-premise rather than externally-hosted solution, although this is becoming less of an issue.
So far so good. But that's just one dimension, and Consultant Union rules clearly state that all topics must be analyzed in a two-dimensional matrix.
It’s tempting to make the second dimension something to do with user skills or ease of use, which are pretty much two sides of the same coin. But everyone wants their system to be as easy to use as possible, and what’s possible depends largely on the complexity of the marketing programs being built. Since the first dimension already relates to program complexity, having ease of use as a second dimension would be largely redundant. Plus, what looks hard to me may seem simple to you, so this is something that’s very hard to measure objectively.
I think a more useful second dimension is the scope of functions supported. This relates to the number of channels and business activities.
- As to channels: any demand generation system will generate outbound emails and Web landing pages, and send leads them to a sales automation system. For many marketing departments, that’s plenty. But some systems also outbound call centers, mobile (SMS) messaging, direct mail, online chat, and RSS feeds. Potential buyers vary considerably in which of these channels they want their system to support, depending on whether they use them and how happy they are with their current solution.
- Business activities can extend beyond the core demand generation functions (basically, campaign planning, content management and lead scoring) to the rest of marketing management: planning, promotion calendars, Web analytics, performance measurement, financial reporting, predictive modeling, and integration of external data. Again, needs depend on both user activities and satisfaction with existing systems.
Scope is a bit tricky as a dimension because systems will have different combinations of functions, and users will have different needs. But it’s easy enough to generate a specific checklist of items for users to consult. A simple count of the functions supported will give a nice axis for a two-dimensional chart.
So that’s my current thinking on the subject: one dimension measures the ability to coordinate distributed marketing programs, and the other measures the scope of functions provided. Let me know if you agree or what you'd propose as alternatives.
Thursday, July 24, 2008
Two Acquisitions Extend SQL Server
I don't usually bother to post "breaking news" here, but I've recently seen two acquisitions by Microsoft that seem worth noting. On July 14, the company announced purchase of data quality software vendor Zoomix, and just today it announced purchase of data appliance vendor DATAllegro. Both deals seem to represent an attempt to make SQL Server a more complete solution--in terms of data preparation in the Zoomix case, and high-end scalability with DATAllegro.
Of the two deals, the DATAllegro one seems more intriguing, only because DATAllegro was so obviously not built around SQL Server to begin with. The whole point of the product was to use open source software (the Ingres database in this case) and commodity components. Switching to the proprietary Microsoft world just seems so, well, different. The FAQ accompanying the announcement makes clear that the DATAllegro technology will only be available in the future in combination with SQL Server. So anyone looking for evidence of a more open-systems-friendly Microsoft will have to point elsewhere.
The Zoomix acquisition seems more straightforward. Microsoft has been extending the data prepartion capabilities of SQL Server for quite some time now, and already had a pretty impressive set of tools. My concern here is that Zoomix actually had some extremely flexible matching and extraction capabilities. These overlap with other SQL Server components, so they are likely to get lost when Zoomix is assimilated into the product. That would be a pity.
Sybase IQ vs. Vertica: Comparisons are Misleading, But Fun
I received the “Vertica Fast Lane” e-newsletter yesterday, which I am amused to note from its URL is generated by Eloqua. (This is only amusing because I’m researching Eloqua for unrelated reasons these days. Still, if I can offer some advice to the Vertica Marketing Department, it’s best to hide that sort of thing.)
The newsletter contained a link to a post on Vertica’s blog entitled “Debunking a Myth: Column-Stores vs. Indexes”. Naturally caught my attention, given my own recent post suggesting that use indexes is a critical difference between SybaseIQ and the new columnar databases, of which Vertica is the most prominent.
As it turned out, the Vertica post addressed a very different issue: why putting a conventional B-tree index on every column in a traditional relational database is nowhere near as efficient as using a columnar database. This is worth knowing, but doesn’t apply to Sybase IQ because IQ’s primary indexes are not B-trees. Instead, most of them are highly compressed versions of the data itself.
If anything, the article reinforced my feeling that what Sybase calls an index and what Vertica calls a compressed column are almost the same thing. The major difference seems to be that Vertica sorts its columns before storing them. This will sometimes allow greater compression and more efficient searches, although it also implies more processing during the data load. Sybase hasn’t mentioned sorting its indexes, although I suppose they might. Vertica also sometimes improves performance by storing the same data in different sort sequences.
Although Vertica’s use of sorting is an advantage, Sybase has tricks of its own. So it’s impossible to simply look at the features and say one system is “better” than the other, either in general or for specific applications. There's no alternative to live testing on actual tasks.
The Vertica newsletter also announced a preview release of the system’s next version, somewhat archly codenamed “Corinthian” (an order of Greek columns—get it?. And, yes, “archly” is a pun.) To quote Vertica, “The focus of the Corinthian release is to deliver a high degree of ANSI SQL-92 compatibility and set the stage for SQL-99 enhancements in follow-on releases.”
This raises an issue that hadn’t occurred to me, since I had assumed that Vertica and other columnar databases already were compliant with major SQL standards. But apparently the missing capabilities were fairly substantial, since “Corinthian” adds nested sub-queries; outer-, cross- and self-joins; union and union-all set operations; and VarChar long string support. These cannot be critical features, since people have been using Vertica without them. But they do represent the sort of limitations that sometimes pop up only after someone has purchased a system and tried to deploy it. Once more, there's no substitute for doing your homework.
Thursday, July 17, 2008
QlikView 8.5 Does More, Costs Less
I haven’t been working much with QlikView recently, which is why I haven’t been writing about it. But I did receive news of their latest release, 8.5, which was noteworthy for at least two reasons.
The first is new pricing. Without going into the details, I can say that QlikView significantly lowered the cost of an entry level system, while also making that system more scalable. This should make it much easier for organizations that find QlikView intriguing to actually give it a try.
The second bit of news was an enhancement that allows comparisons of different selections within the same report. This is admittedly esoteric, but it does address an issue that came up fairly often.
To backtrack a bit: the fundamental operation of QlikView is that users select sets of records by clicking (or ‘qliking’, if you insist) on lists of values. For example, the interface for an application might have lists of regions, years and product, plus a chart showing revenues and costs. Without any selections, the chart would show data for all regions, years and products combined. To drill into the details, users would click on a particular combination of regions, years and products. The system would then show the data for the selected items only. (I know this doesn’t sound revolutionary, and as a functionality, it isn’t. What makes QlikView great is how easily you, or I, or a clever eight-year-old, could set up that application. But that’s not the point just now.)
The problem was that sometimes people wanted to compare different selections. If these could be treated as dimensions, it was not a problem: a few clicks could add a ‘year’ dimension to the report I just described, and year-to-year comparisons would appear automatically. What was happening technically was the records within a single selection were being separated for reporting.
But sometimes things are more complicated. If you wanted to compare this year’s results for Product A against last year’s results for Product B, it took some fairly fancy coding. (Not all that fancy, actually, but more work than QlikView usually requires.) The new set features let users simply create and save one selection, then create another, totally independent selection, and compare them directly. In fact, you can bookmark as many selections as you like, and compare any pair you wish. This will be very helpful in many situations.
But wait: there’s more. The new version also supports set operations, which can find records that belong to both, either or only one of the pair of sets. So you could easily find customers who bought last year but not this year, or people who bought either of two products but not both. (Again, this was possible before, but is now much simpler.) You can also do still more elaborate selections, but it gives me a headache to even think about describing them.
Now, I’m quite certain that no one is going to buy or not buy QlikView because of these particular features. In fact, the new pricing makes it even more likely that the product will be purchased by business users outside of IT departments, who are unlikely to drill into this level of technical detail. Those users see QlikView as essentially as a productivity tool—Excel on steroids. This greatly understates what QlikView can actually do, but it doesn’t matter: the users will discover its real capabilities once they get started. What’s important is getting QlikView into companies despite the usual resistance from IT organizations, who often (and correctly, from the IT perspective) don’t see much benefit.
Saturday, July 12, 2008
Sybase IQ: A Different Kind of Columnar Database (Or Is It The Other Way Around?)
I spent a fair amount of time this past week getting ready for my part in the July 10 DM Radio Webcast on columnar databases. Much of this was spent updating my information on SybaseIQ, whose CTO Irfan Khan was a co-panelist.
Sybase was particularly eager to educate me because I apparently ruffled a few feathers when my July DM Review column described SybaseIQ as a “variation on a columnar database” and listed it separately from other columnar systems. Since IQ has been around for much longer than the other columnar systems and has a vastly larger installed base—over 1,300 customers, as they reminded me several times—the Sybase position seems to be that they should be considered the standard, and everyone else as the variation. (Not that they put it that way.) I can certainly see why it would be frustrating to be set apart from other columnar systems at exactly the moment when columnar technology is finally at the center of attention.
The irony is that I’ve long been fond of SybaseIQ, precisely because I felt its unconventional approach offered advantages that few people recognized. I also feel good about IQ because I wrote about its technology back in 1994, before Sybase purchased it from Expressway Technologies—as I reminded Sybase several times.
In truth, though, that original article was part of the problem. Expressway was an indexing system that used a very clever, and patented, variation on bitmap indexes that allowed calculations within the index itself. Although that technology is still an important feature within SybaseIQ, it now supplements a true column-based data store. Thus, while Expressway was not a columnar database, SybaseIQ is.
I was aware that Sybase had extended Expressway substantially, which is why my DM Review article did refer to them as a type of columnar database. So there was no error in what I wrote. But I’ll admit that until this week’s briefings I didn’t realize just how far SybaseIQ has moved from its bitmapped roots. It now uses seven or nine types of indexes (depending on which document you read), including traditional b-tree indexes and word indexes. Many of its other indexes do use some form of bitmaps, often in conjunction with tokenization (i.e., replacing an actual value with a key that points to a look-up table of actual values. Tokenization saves space when the same value occurs repeatedly, because the key is much smaller than the value itself. Think how much smaller a database is if it stores “MA” instead of “Massachusetts” in its addresses. )
Of course, tokenization is really a data compression technique, so I have a hard time considering a column of tokenized data to be an index. To me, an index is an access mechanism, not the data itself, regardless of how well it’s compressed. Sybase serenely glides over the distinction with the Zen-like aphorism that “the index is the column” (or maybe it was the other way around). I’m not sure I agree, but the point doesn’t seem worth debating
Yet, semantics aside, SybaseIQ’s heavy reliance on “indexes” is a major difference between it and the raft of other systems currently gaining attention as columnar databases: Vertica, ParAccel, Exasol and Calpont among them. These systems do rely heavily on compression of their data columns, but don’t describe (or, presumably, use) these as indexes. In particular, so far as I know, they don’t build different kinds of indexes on the same column, which IQ treats as a main selling point. Some of the other systems store several versions of the same column in different sort sequences, but that’s quite different.
The other very clear distinction between IQ and the other columnar systems is that IQ uses Symmetrical Multi-Processing (SMP) servers to process queries against a unified data store, while the others rely on shared nothing or Massively Multi-Processor (MMP) servers. This reflects a fundamentally different approach to scalability. Sybase scales by having different servers execute different queries simultaneously, relying on its indexes to minimize the amount of data that must be read from the disk. The MPP-based systems scale by partitioning the data so that many servers can work in parallel to scan it quickly. (Naturally, the MPP systems do more than a brute-force column scan; for example, those sorted columns can substantially reduce read volumes.)
It’s possible that understanding these differences would allow someone to judge which type of columnar system works better for a particular application. But I am not that someone. Sybase makes a plausible case that its approach is inherently better for a wider range of ad hoc queries, because it doesn’t depend on how the data is partitioned or sorted. However, I haven’t heard the other vendors’ side of that argument. In any event, actual performance will depend on how the architecture has been implemented. So even a theoretically superior approach will not necessarily deliver better results in real life. Until the industry has a great deal more experience with the MPP systems in particular, the only way to know which database is better for a particular application will be to test them.
The SMP/MPP distinction does raise a question about SybaseIQ’s uniqueness. My original DM Review article actually listed two classes of columnar systems: SMP-based and MPP-based. Other SMP-based systems include Alterian, SmartFocus, Infobright, 1010Data and open-source LucidDB. (The LucidDB site contains some good technical explanations of columnar techniques, incidentally.)
I chose not to list SybaseIQ in the SMP category because I thought its reliance on bitmap techniques makes it significantly different from the others, and in particular because I believed it made IQ substantially more scalable. I’m not so sure about the bitmap part anymore, now that realize SybaseIQ makes less use of bitmaps than I thought, and have found that some of the other vendors use them too. On the other hand, IQ’s proven scalability is still much greater than any of these other systems—Sybase cites installations over 100 TB, while none of the others (possibly excepting Infobright) has an installation over 10 TB.
So where does all this leave us? Regarding SybaseIQ, not so far from where we started: I still say it’s an excellent columnar database that is significantly different from the (MPP-based) columnar databases that are the focus of recent attention. But, to me, the really important word in the preceding sentence is “excellent”, not “columnar”. The point of the original DM Review article was that there are many kinds of analytical databases available, and you should consider them all when assessing which might fit your needs. It would be plain silly to finally look for alternatives to conventional relational databases and immediately restrict yourself to just one other approach.
Thursday, July 03, 2008
LucidEra Takes a Shot at On-Demand Analytics
Back in March, I wrote a fairly dismissive post about on-demand business intelligence systems. My basic objection was that the hardest part of building a business intelligence system is integrating the source data, and being on-demand doesn’t make that any easier. I still think that’s the case, but did revisit the topic recently in a conversation with Ken Rudin, CEO of on-demand business analytics vendor Lucid Era.
Rudin, who has plenty of experience with both on-demand and analytics from working at Salesforce.com, Siebel, and Oracle, saw not one but two obstacles to business intelligence: integration and customization. He described LucidEra’s approach as not so much solving those problems as side-stepping them.
The key to this approach is (drum roll…) applications. Although LucidEra has built a platform that supports generic on-demand business intelligence, it doesn’t sell the platform. Rather, it sells preconfigured applications that use the platform for specific purposes including sales pipeline analysis, order analysis, and (just released) sales lead analysis. These are supported by standard connectors to Salesforce.com, NetSuite (where Rudin was an advisory board member) and Oracle Order Management.
Problem(s) solved, eh? Standard applications meet customer needs without custom development (at least initially). Standard connectors integrate source data without any effort at all. Add the quick deployment and scalability inherent in the on-demand approach, and, presto, instant business value.
There’s really nothing to argue with here, except to point out that applications based on ‘integrating’ data from a single source system can easily be replaced by improvements to the source system itself. LucidEra fully recognizes this risk, and has actually built its platform to import and consolidate data from multiple sources. In fact, the preconfigured applications are just a stepping stone. The company’s long-term strategy is to expose its platform so that other people can build their own applications with it. This would certainly give it a more defensible business position. Of course, it also resurrects the customization and integration issues that the application-based strategy was intended to avoid.
LucidEra would probably argue that its technology makes this customization and integration easier than with alternative solutions. My inner database geek was excited to learn that the company uses a version of the columnar database originally developed by Broadbase (later merged with Kana), which is now open source LucidDB. An open source columnar database—how cool is that?
LucidEra also uses the open source Mondrian OLAP server (part of Pentaho) and a powerful matching engine for identity resolution. These all run on a Linux grid. There is also some technology—which Rudin said was patented, although I couldn’t find any details—that allows applications to incorporate new data without customization, through propagation of metadata changes. I don’t have much of an inner metadata geek, but if I did, he would probably find that exciting too.
This all sounds technically most excellent and highly economical. Whether it significantly reduces the cost of customization and integration is another question. If it allows non-IT people to do the work, it just might. Otherwise, it’s the same old development cycle, which is no fun at all.
So, as I said at the start of all this, I’m still skeptical of on-demand business intelligence. But LucidEra itself does seem to offer good value.
My discussion with LucidEra also touched on a couple of other topics that have been on my mind for some time. I might as well put them into writing so I can freely enjoy the weekend.
- Standard vs. custom selection of marketing metrics. The question here is simply whether standard metrics make sense. Maybe it’s not a question at all: every application presents them, and every marketer asks for them, usually in terms of “best practices”. It’s only an issue because when I think about this as a consultant, and when I listen to other consultants, the answer that comes back is that metrics should be tailored to the business situation. Consider, for example, choosing Key Performance Indicators on a Balanced Scorecard. But vox populi, vox dei (irony alert!), so I suppose I’ll have to start defining a standard set of my own.
- Campaign analysis in demand generation systems. This came up in last week’s post and the subsequent comments, which I highly recommend that you read. (There may be a quiz.) The question here is whether most demand generation systems (Eloqua, Vtrenz, Marketo, Market2Lead, Manticore, etc.) import sales results from CRM systems to measure campaign effectiveness. My impression was they did, but Rudin said that LucidEra created its lead analysis system precisely because they did not. I’ve now carefully reviewed my notes on this topic, and can tell you that Marketo and Market2Lead currently have this capability, while the other vendors I’ve listed should have it before the end of the year. So things are not quite as rosy as I thought but will soon be just fine.
Wednesday, July 02, 2008
The Value of Intra-Site Web Search: A Personal Example
I’ll do a real post later today or more likely tomorrow, but I thought I’d quickly share a recent personal experience that illustrated the importance in e-commerce of really good in-site search.
By way a background: having a good search capability is one of those Mom-and-apple-pie truths that everyone fully accepts in theory, but not everyone bothers to actually execute. So perhaps being reminded of the real-life value of doing it right will inspire some reader—maybe even YOU—to take another look at what you’re doing and how to improve it.
Anyway, I recently needed a notebook PC with a powerful video card for gaming on short notice. Or, at least, one of my kids did. He quickly found a Web site http://www.notebookcheck.com/ that had an excellent ranking of the video cards. But there are many dozens of cards even in the high-performance category, so I couldn’t just type them all into a search box, either on Google or within an e-commerce site. Nor did video cards within a given unit necessarily show up in search results even when I tried entering them individually.
To make a long story short, we found that on-line computer retailer NewEgg had a “power search” option that give checkboxes for what are presumably all available options in a wide variety of system parameters—product type, manufacturer, series, CPU type, CPU speed, screen size, wide screen support, resolution, operating system, video card, graphic type, disk size, memory, optical drive type, wireless LAN, blue tooth, Webcam and weight. This meant I could click off the video cards I was looking for, as well as other parameters such as screen size and weight class. The results came back, and that was that.
We weren’t necessarily thrilled with the product choices at NewEgg, and there were several minor snafus that left me a little annoyed with them. But I couldn’t find any other site with a way to efficiently locate the systems I needed. So they got the sale.
(In case you're wondering: yes I would order again and, for all you Net Promoter Score fans, I suppose I would recommend them if someone asked. But they missed an opportunity to become my preferred vendor for this sort of thing, a nuance the Net Promoter Score would fail to pick up.)
I suppose there is a slight marketing technology angle to this story as well. NewEgg has to somehow populate its checkboxes with all that information. They must do this automatically since it constantly changes. This requires parsing the data from specification sheets into a database. As data extraction challenges go, this isn’t the hardest I can imagine, but it’s still a bit of work. It should be a good use case or case study for somebody in that industry.
Wednesday, June 25, 2008
More Blathering About Demand Generation Software
When I was researching last week’s piece on Market2Lead, one of the points that vendor stressed was their ability to create a full-scale marketing database with information from external sources to analyze campaign results. My understanding of competitive products was that they had similar capabilities, at least hypothetically, so I choose not to list that as a Market2Lead specialty.
But I recently spoke with on-demand business intelligence vendor LucidEra , who also said they had found that demand generation systems could not integrate such information. They even cited one demand generation vendor that had turned to them for help. (In fact, LucidEra is releasing a new module for lead conversion analysis today to address this very need. I plan to write more about LucidEra next week.)
Yet another source, Aberdeen Group’s recent study on Lead Prioritization and Scoring: The Path to Higher Conversion (free with registration, for a limited time) also showed that linking marketing campaigns to closed deals to be the least commonly available among all the key capabilities required for effective lead management. Just 64% of the best-in-class vendors had this capability, even though 92% had a lead management or demand generation system.
Quite frankly, these results baffle me, because every demand generation vendor I’ve spoken with has the ability to import data from sales automation systems. Perhaps I'm missed some limit on exactly what kind of data they can bring back. I’ll be researching this in more detail in the near future, so I’ll get to the bottom of it fairly soon.
In the meantime, the Aberdeen report provided some other interesting information. Certainly the overriding point was that technology can’t do the job by itself: business processes and organizational structures must be in place to ensure that marketing and sales work together. Of course, this is true about pretty much any technology, but it’s especially important with lead management because it crosses departmental boundaries. Unfortunately, this is also a rather boring, nagging, floss-your-teeth kind of point that isn’t much fun to discuss once you’re made it. So, having tipped our hat to process, let’s talk about technology instead.
I was particularly intrigued at what Aberdeen found about the relative deployment rates for different capabilities. The study suggests—at least to me; Aberdeen doesn’t quite put it this way—that companies tend to start by deploying a basic lead management platform, followed by lead nurturing programs, and then adding lead prioritization and scoring. These could all be done by the same system, so it’s less a matter of swapping software as you move through the stages than of making fuller use of the system.
If you accept this progression, then prioritization and scoring is at the leading edge of lead management sophistication. Indeed, it is the least common of the key technologies that Aberdeen lists, in place at just 77% of the best-in-class companies. (Although the 64% figure for linking campaigns to closed deals is lower, Aberdeen lists that under performance measurement, not technology.) Within lead scoring itself, Aberdeen reports that customer-provided information such as answers to survey questions are used more widely than inferred information such as Web site behavior. Aberdeen suggests that companies will add inferred data, and in general make their scoring models increasingly complex, as they grow in sophistication.
This view of inferred data in particular and scoring models in general as leading edge functions is important. Many of the demand management vendors I’ve spoken with are putting particular stress on these areas, both in terms of promoting their existing capabilities and of adding to them through enhancements. In doing this, they are probably responding to the demands of their most advanced customers—a natural enough reaction, and one that is laudably customer-driven. But there could also be a squeaky wheel problem here: vendors may be reacting to a vocal minority of existing customers, rather than a silent majority of prospects and less-advanced clients who have other needs. Weaknesses in campaign results reporting, external data integration and other analytics are one area of possible concern. General ease of use and customization could be another.
In a market that is still in its very early stages, the great majority of potential buyers are still quite unsophisticated. It would be a big mistake for vendors to engage in a typical features war, adding capabilities to please a few clients at the cost of adding complexity that makes the system harder for everyone else. Assuming that buyers can accurately assess their true needs—a big if; who isn’t impressed by bells and whistles?—adding too many features would harm the vendors own sales as well.
The Aberdeen report provides some tantalizing bits of data on this issue. It compares what buyers said was important during the technology assessment with what they decided was important after using the technology. But I’m not sure what is being reported: there are five entries in each group (the top five, perhaps?), of which only “customizable solution” appears in both. The other four listed for pre-purchase were: marketing maintained and operated; easy to use interface; integration with CRM; and reminders and event triggers. The other four for post-purchase were: Web analytics; lead scoring flexibility; list segmentation and targeting; and ability to automate complex models.
The question is how you interpret this. Did buyers change their minds about what mattered, or did their focus simply switch once they had a solution in place? I’d guess the latter. From a vendor perspective, of course, you want to emphasize features that will make the sale. Since ease of use ranks in the pre-purchase group, that would seem to favor simplicity. But you want happy customers too, which means providing the features they’ll need. So do you add the features and try to educate buyers about why they’re important? Or do you add them and hide them during the sales process? Or do you just not add them at all?
Would your answer change if I told you, Monty Hall style, that there is little difference between best-in-class companies and everyone else on the pre-sales considerations, but that customization and list segmentation were much less important to less sophisticated customers in the post-sales ranking?
In a way, this is a Hobson’s choice: you can’t not provide the features customers need to do their jobs, and you don’t want to them to start with you and switch to someone else. So the only question is whether you try to hide the complexity or expose it in all its glory. The latter would work for advanced buyers, but, at this stage in the market, those are few in number. So it seems to me that clever interface design—exposing just as many features as the customer needs at the moment--is the way to go.
Wednesday, June 18, 2008
Market2Lead Offers Enterprise-Strength Demand Generation System
Market2Lead offers the usual list of demand generation functions: outbound email, Web forms and landing pages, automated lead nurturing, integration with sales, and campaign return on investment analysis. But while many demand generation vendors simplify these features so marketers can run them for themselves, Market2Lead offers no such compromises. It is designed for world-wide deployment at large enterprises, where even the marketing department will have significant technical resources. This lets the system include capabilities that large installations need and other systems may have skipped.
This is not to say that Market2Lead is especially hard to use. Although the interface is not particularly pretty, the effort to set up a simple campaign is probably about the same as in other demand generation systems. That difference is that Market2Lead is designed to work with other company systems, rather than assuming it will provide almost all of the marketing department’s customer-facing functions. It also provides the administrative muscle needed to manage large marketing programs.
Let’s talk first about working with other company systems, because that strikes me as the most distinctive aspect of Market2Lead. Nearly all demand management systems have built-in email engines and Web servers for forms and microsites. This makes these functions as simple as possible to set up and use. But Market2Lead does not provide its own email services. Instead, it provides an API that lets users set up their emails with Market2Lead and then have them sent by external email specialists like Responsys and Exact Target. Market2Lead’s approach to Web pages is more flexible: users can either build and serve Web templates within Market2Lead, or they can embed Market2Lead tags in externally-hosted pages. These tags call Market2Lead content, including personalized messages and Web forms.
Administrative capabilities to support large marketing programs are the sum of many details. Components including lists, offers and Web forms are stored in libraries where they can be standardized and reused across campaigns. Campaigns and programs within campaigns have start and end dates, which the system can use to automatically adjust the campaign flow after an end date is reached. Users can define standard process flows for outbound campaigns (such as Webinar invitations) and inbound responses (such as inquiries), again to standardize processes and save rework. Offer and campaign priorities are determined by numbers rather than placement in a traditional flow chart, making them easy to rearrange. Suppression lists can be applied automatically to all campaigns, allowing the system to enforce limits on the number of contacts per person. Logic to select questions needed to complete a prospect’s profile is managed centrally rather than embedded separately within each form.
Market2Lead also supports large marketers with multi-language capabilities. It can support programs in 42 languages, store a default language for each prospect, and capture information in different languages from the same person.
Working in yet another dimension, the system extends to channels beyond Web and email. It can manage call center scripts internally, using special versions of its Web forms. Sales force contacts are, of course, captured through two-way integration Salesforce.com and other sales automation systems. Data from still other sources can be merged using data integration tools including a customer matching engine. Users can analyze the resulting marketing database with Informatica reporting tools. There are also standard reports on campaign effectiveness and marketing opportunities. Reports can show how often each list and offer is used and can show the offers and lists used within a campaign. The system show which campaigns use a given list or Web form, but not (yet) which campaigns use a given offer.
Like other demand generation systems, Market2Lead measures campaign effectiveness by importing sales opportunity results from the sales force system. These are tied to marketing campaigns by linking the sales opportunity to prospects, linking prospects to marketing activities, and linking the activities to campaigns. These revenues are matched against campaign costs to calculate return on investment. The system takes a fairly sophisticated approach to this process: it can credit revenue to either the first or last campaign linked to a sale, or share the revenue among multiple campaigns based on user-defined weights. The vendor is researching data mining features to help users determine the appropriate weights.
All of this is impressive, but none of it would matter if the core campaign engine were problematic. But it’s just fine. The basic approach is similar to other campaign managers: users define selection rules for each campaign, and then a series of steps the selected prospects will follow. In the Market2Lead, the selections are expressed as list memberships. These can be frozen at the time of initial selection or dynamically reselected on a regular schedule. Reselection is what lets the system enforces contact limits, since it can continuously recheck whether each prospects has received the maximum number of messages.
Each step within the campaign is defined by an automation rule. These have four components: a “trigger event” such as an email being opened; additional qualifying conditions based on attributes or previous behaviors; a wait period; and a next action to take if the preceding conditions are met.
The first three of these are about what you’d expect. But the next action is more interesting. It can execute the next program within the campaign, exit the campaign, or move the prospect to a different campaign. But the "next" program is not selected from a fixed sequence. Rather, Market2Lead can dynamically select from a list of programs associated with the campaign. Each program has a user-assigned business value and its own qualification conditions. The system can rank the programs by highest, lowest or random value, and will then pick the first program within this ranking that the current prospect is qualified to receive.
You might want to read that last sentence again, because there's a lot going on here. Between the rankings and offer qualifications, a single campaign step can deliver completely different experiences for different prospects without explicit programming. In addition, users can change those experiences without changing the campaign logic itself, simply by altering the business value or qualification rules. Since the same program can be used in different campaigns, a single change can modify many campaigns at once.
One thing the system cannot do is dynamically recalculate the business value itself based on the individual prospect's attributes. Market2Lead is researching this capability.
This approach is admittedly more complicated than setting up a simple campaign in some other demand generation systems. But it all makes sense and will ultimately be more efficient for large marketing operations once you get the hang of it. In any case, Market2Lead says the system is usually run by a marketing operations specialist, who prepares standard program flows and content templates that marketing program managers can then customize for themselves. Training this person and setting up the initial campaign including flows and content templates takes four to six weeks.
As the very notion of a dedicated marketing operations specialist implies, we are talking here about large organizations. Indeed, Market2Lead lists Cisco, Citrix, Interwoven, Netgear, Polycom, SGI, Sungard and Tibco among its 50+ clients. The company does serve smaller organizations as well, and in fact can provide services for clients who do not want to run it for themselves.
Market2Lead offers several configurations of the system with different prices and capabilities. All versions are available as hosted services, and enterprise clients can also install it in-house. Pricing depends on the version, database size and transaction volume and ranges from $60,000 to $100,000 for a mid-market solution. The company was founded in 2003.
Monday, June 16, 2008
Raab on DM Radio Panel on July 10
I'm scheduled to appear on a DM Radio panel on columnar databases on July 10. I'll be joining Dr. Michael Stonebraker, architect of the modern INGRES and POSTGRES database designs, and CTO/Founder of columnar database developer Vertica, and several additional guests.
For more information and to register, visit http://www.dmreview.com/dmradio/10001493-1.html.
For more information and to register, visit http://www.dmreview.com/dmradio/10001493-1.html.
Tuesday, June 10, 2008
Marketo Aims to Simplify Demand Generation
As I wrote last week, demand generation vendors have a hard time differentiating their systems from each other. One company that has made a concerted effort is newcomer Marketo. Marketo has a one-word elevator speech: simplicity.
That’s not to say Marketo is a simple product. Functionally, it covers all the demand generation bases: outbound email, landing pages, Web site monitoring, lead scoring, multi-step nurturing programs, prospect database, analytics, Salesforce.com integration. It even adds A/B testing for landing pages, which you don’t see everywhere. The depth in each area is perfectly respectable as well.
Where simplicity comes in is the user interface. Like every other demand generation vendor, Marketo has wrestled with how a branching, multi-step lead nurturing campaign can be made easy enough for non-specialist users. The traditional approach has been a flow chart with lines and boxes. This is, after all, the way “real” process diagrams are built by programmers and engineers. It does express the logic of each flow precisely, but it also can get incomprehensibly complex very quickly.
Marketo’s solution is to do away with the branches. Each campaign flow is presented as a list, and any deviation from the sequence is treated as a diversion to another flow. The list itself can be presented in a collapsed format with each step as a numbered item, or an expanded format where the actions taken at each step are exposed. (Or, users can expand a single step at a time.) Actions include adding or removing the lead from a list, changing a data value or score, sending an email, moving the lead to a different flow, removing it from all flows, and waiting a specified period of time. The system can also add the lead to a Salesforce.com database, assign or change the owner in Salesforce.com, and create a Salesforce.com task. Each action can be associated with a set of conditions that determine whether or not it is executed. One step can include multiple actions, each with its own conditions. The system can be told to execute only the first action whose execution conditions are met, which is one way to implement branching logic .
Other components of Marketo are more conventional, although still designed with simplicity in mind. Users can set up Web landing pages and email templates using a drag-and-drop interface modeled on PowerPoint—the one tool, as Marketo points out, that every marketer is guaranteed to know how to use. These templates can include variables selected from the Marketo database for personalization. Users can also create forms to capture data provided by site visitors or read automatically from the form or URL parameters. Forms can be reused across campaigns.
Campaign lists are built with another drag-and-drop interface, allowing users to layer multiple selection conditions. These can be based on lead data and constraints such as Web search terms, event frequency, and date ranges. Lists can be frozen after selection or dynamically refreshed each time they are used. Users can review the members of a list and click on a name to see its details, including the log of messages sent and activities recorded in Marketo. Like other demand generation systems, Marketo uses cookies to track the behavior of anonymous Web visitors and merge these into the lead record if the visitor later identifies herself. Lead scores are calculated by adding or subtracting points for user-specified behaviors. These values can automatically be reduced as time passes after an event.
Leads can also enter a campaign through triggers. Trigger events can include clicking on a link, filling out a form, changing a data value, creating a new lead record, and being added to a list. The system reacts to triggers as soon as they happen, rather than waiting for lists to be updated.
Campaigns can be scheduled to run once or at regular intervals. So can the wide range of standard reports covering, covering campaign results, email performance, Web activity and lead statistics. Users can run a report against a specified list and can have a report automatically emailed to them on a regular basis. A custom report builder is due by the end of July.
Marketo’s integration with Salesforce.com also bolsters its claim to simplicity. The system feeds data to Salesforce in real time and receives data from Salesforce every five minutes. This will go to real time as soon as Salesforce permits it. The integration is based on the Salesforce Force.com platform, which allows new installations of Marketo to connect with Salesforce in minutes. It also allows Marketo fields to appear within the regular Salesforce tabs, instead of a tab of its own. The lead activity summary from Marketo does appear separately within Salesforce.
It more or less goes without saying that Marketo is sold as a hosted service. This, combined with the automatic Salesforce.com integration, enables new clients to get started very quickly. The company cited implementations in as little as 24 hours, although I’m not sure this is a standard promise. They do say users become proficient after two hours of training. Perhaps the most convincing evidence that the system is easy to install is that the company doesn’t charge a separate set-up fee—definitely not something all its competitors can say.
In fact, Marketo pricing is about as simple as it gets: a straight monthly fee ranging from $1,500 to $10,000 depending on the number of leads, page views and email contacts.
Marketo was founded in late 2005 by veterans of Epiphany. Its leaders spent the first two years researching market requirements and raising capital. They officially launched the Marketo product in March of this year and now have about 35 clients. These are primarily mid-to-large business-to-business marketers.
Friday, June 06, 2008
Oh, the Irony! Do Demand Generation Vendors Have A Sound Marketing Strategy?
There are literally dozens of vendors offering “demand generation” software, which can be roughly defined as systems to generate and nurture leads before turning them over to sales. Their function lists usually sound pretty much alike: outbound email campaigns to generate leads; Web landing pages to capture responses; lead scoring to determine how to treat them; multi-step email campaigns to nurture them; integration with sales automation systems; and analytics to track the results.
It’s a situation that cries out for vendors to specialize in different customer segments, but so far the only division along those lines seems to be that some vendors focus on small businesses while others target mid-size and larger organizations. If anyone has taken the obvious next step of creating vertical packages for specific industries, I haven’t seen it. (Of course, given how many vendors there are and the fact that I do like to sleep occasionally, it’s quite possible that these do exist.)
My guess, however, is that most competitors in this market (and their financial backers) are not yet ready to give up the dream of being the dominant player in a single, unified industry. The generic approach may also reflect the origins of many vendors in technologies like Web analytics and email campaigns, which themselves have not fragmented into vertical specialties. And I suppose the underlying features required for demand generation are in fact largely the same across most segments, so there is little technical reason to specialize.
One implication of this is that resellers, who do tend to specialize by industry, will play an important role in making these systems work for most users. This is what happened with sales automation software. If I’m correct, then the demand generation vendors should be competing aggressively to attract reseller support. I can’t say I’ve seen much of that either—so, again, maybe I’ve missed it. Or maybe deployment of these systems is so simple that resellers can’t make any money doing it. If that were the case—and I’m not convinced it is—then we’d expect vendors who already assist marketers, such as advertising and publicity agencies, to offer the tools as an extension of their own services. I’ve seen a bit of that, but it doesn’t seem to be the main strategy the demand generation vendors are pursuing.
So if demand generation vendors are not staking out vertical specialties or pursuing channel partners, just how do they seem to compete? Many show a reassuring confidence in their own systems, running exactly the sorts of lead generation and nurturing programs they are proposing for others. These are, or should be, coupled with attempts to build superior sales organizations that will close the leads the systems generate. Perhaps this sort of ferocious, nuts-and-bolts approach to sales and marketing is all they really need to win.
And yet, it would be more than a little ironic if companies that hope to sell to marketers were themselves ignoring the strategic marketing issues of branding, differentiation and segmentation. Ironic, but not inconceivable: the demand generation vendors are after all business-to-business marketers, selling primarily to other business marketers, who often pay much less attention to the grand marketing strategies than their consumer marketing counterparts. For better or worse, many business marketers focus primarily on product features and technologies, despite ample historical evidence that the best product does not always win. It should not be surprising that many demand generation marketing programs take a similar approach.
That said, some demand generation systems do seem to have a clearer approach to positioning themselves in the market. This post was going to profile one such vendor. But the preceding introduction ran on for so long that I think I’ll write about that vendor in a separate post next week instead. After all, it’s a Friday afternoon in the summer. Enjoy your weekend.
Subscribe to:
Posts (Atom)


