Summary: Youcalc is an on-demand analytics vendor with 130 prepackaged applications primarily for sales and marketing reporting. Unlike its competitors, youcalc it reads data directly from other Software-as-a-Service systems rather than loading it into its own database. This saves money and simplifies installation but has some drawbacks too. Still, it's an intriguing alternative to the standard approach.
Youcalc is fundamentally different from other on-demand analytics vendors like Birst, Cloud9 Analytics, Gooddata and Pivotlink: while those vendors all query data stored in their system, youcalc queries the source data directly. That is, youcalc provides analytical applications that read from an existing system, typically a Software-as-a-Service vendor like Salesforce.com or Google AdWords.
Although this sounds like a subtle difference, the implications are huge. It means that youcalc doesn’t need the infrastructure to build and store client databases, thereby reducing its costs dramatically.
It also means that youcalc can to give each new client immediate access to standard applications, since there is no need to adjust for differences in their data. Although this is possible with prebuilt applications at other on-demand analytics vendors, youcalc has made it more central to their business model. In fact, youcalc extends this to related community concepts such as user-contributed enhancements, forums, tagging and rating of popular applications.
I’m intrigued by the youcalc approach but do see some disadvantages. One is that data integration capabilities are limited: the current version of the system can only combine data sources that already share common keys or are linked with an existing cross reference table. I suppose it’s technically possible to allow more sophisticated data matching, but any processing will still be limited by the need to repeat it each time the data is read from its sources and loaded into memory.
A second, more fundamental limitation is that the system can’t access historical data, such as point-in-time snapshots of information which is not retained in operational systems. At best, youcalc could point to an externally-built data warehouse as a source – but now you’re back doing all the database development that youcalc is supposed to avoid. No free lunch here, folks.
Still, there are those cost savings. Youcalc is priced at an astonishingly low $19.95 per user per month, which gives access to 130+ prebuilt applications for products including Salesforce.com, SugarCRM, Google AdWords, Google Analytics, MailChimp and 37Signals’ BaseCamp (project management) and Highrise (contact management). There’s also a free version that is excludes some of the more powerful applications. The full set is available for a 30 day free trial.
Unfortunately, these prices may not last. CEO Rasmus Madsen told me the company plans eventually to charge higher fees for applications linked to higher priced source systems.
None of this would matter if the youcalc applications and underlying technology weren't worth having. But I found them quite impressive.
Applications can contain multiple objects such as charts and lists. They can also contain drop-down selection boxes to filter components and select alternative chart dimensions. A single application can have multiple pages linked by menus. Users can embed images, text notes and external URLs, and have control over style details such as type fonts and background colors. Although the presentation is nowhere near as advanced as products like Tableau or TIBCO Spotfire, it is competitive with other on-demand analytics systems.
Most current youcalc applications display a single chart from a single data source, such as “Time-Day Distribution for Google Analyzer”. But users can change the contents by selecting different dimensions (e.g., date range) and metrics (e.g. visits, new visitors, bounces, etc.). Some applications combine multiple data sources, such as the “AdWords Campaign ROI Overview for Salesforce.com” that compares cost from Google AdWords with revenue from Salesforce.com.
Users can modify these applications or create their own from scratch (although all the existing applications were built by youcalc). Development is done with Java-based desktop software that runs on Windows, Mac or Linux PCs. The interface involves dragging different components onto a whiteboard and then configuring and connecting them. There are two different whiteboards, one to show the actual application and another to display the flows used to construct each object. These flows begin with connection to an external data source and then send the data through functions to apply formulas, convert formats, create summaries, and perform other tasks. Parameters of each function can be edited during the set-up or connected to objects like drop-down menus for end-user interaction. A completed application can be saved as a stand-alone Web page, a mobile phone Web page, embedded within an external page, or deployed as a widget on an iGoogle home page.
None of this requires actual programming, and basic tasks should be easy enough for a skilled spreadsheet jockey. More demanding activities, such as connecting to an in-house data source, take considerable technical understanding. (The system doesn’t query in-house resources directly; rather, it sends a message to a “listener” on the in-house system, which runs the specified query and transmits the results back as an XML data stream.) Connections for standard sources such as Salesforce.com are very simple since they’re prebuilt: users just enter their log-in credentials and the system does the rest.
If youcalc has an Achilles heel, it will turn out to be data volume. The system accesses standard sources (Salesforce.com, AdWords, etc.) through their APIs, which often limit the number of records that can be pulled at once. Youcalc connectors can submit new calls until all the data has been read, but this is still awkward and will probably be slow for large volumes.
In addition, the data must be loaded into system memory during each user session. This also imposes some practical limits—we’re probably talking in the multi-gigabyte range—even though youcalc runs in the Amazon data cloud, which gives it access to very large servers. Madsen says the largest current installation works with data for 150 Salesforce.com users.
Youcalc was launched in its current form at the end of 2008, although the company has been working on its core technologies since 2003. Madsen said that 4,000 accounts were created in the first six months since launch, and there are currently more than 7,000 application sessions per week. Most are from small businesses, which makes sense for any number of reasons including price, functionality and ease of deployment. The company hopes eventually to attract larger firms as well.
Showing posts with label on-demand software. Show all posts
Showing posts with label on-demand software. Show all posts
Monday, August 03, 2009
Tuesday, July 07, 2009
LucidEra's Failure: More Evidence that Marketers Won't Pay for Measurement
I’m just catching up with what happened while I was on vacation these past two weeks. One piece of news is the demise of LucidEra, which this blog profiled almost exactly one year ago. According to SearchDataManagement.com, the company said it shut down because it couldn’t raise new funds or find a buyer.
There has been some learned discussion of the causes of LucidEra’s collapse on Timo Elliot’s BI Questions Blog. Much seems to focus on the apparent operating costs. These must have been substantial, since the company raised $15.6 million in 2007 and, presumably, has since spent it all.
Still, I think the fundamental problem was a lack of customers. When I spoke with LucidEra in June 2008 they said they had about 40 paying clients. When I spoke with them again in October 2008, the number was 50 and it was still at 50 when we spoke in April 2009. In other words, LucidEra was making very few sales or, even worse, was able to make new sales but couldn’t retain its customers. [For more insight based on comments by LucidEra managers, see this post on the Datadoodle blog.]
With the benefit of 20/20 hindsight, LucidEra’s strategic decision to focus on building sales analysis applications primarily for Salesforce.com was a mistake. Bear in mind that there are about 60,000 Salesforce.com customers – selling to 50 of them is less than 0.1% penetration.
I suspect LucidEra’s price point, around $3,000 per month depending on the details, was too rich for many of its prospective clients. Not that they couldn’t actually afford it – but they didn’t want to spend that much money on sales analysis.
This is not surprising. I reluctantly concluded some time ago that marketers (and presumably sales managers) are not willing to spend money on measurement systems even though they consistently say in surveys that better measurement is a high priority. For recent evidence along these lines, see the 2009 Marketing ROI and Measurements Study published by Lenskold Group and sponsored by MarketSphere, which found that “6 in 10 firms (59%) indicate having an increased demand for marketing measurements, analysis and reporting in 2009 without the budget necessary for those measurement efforts.”
Many analysts and other on-demand business intelligence vendors have been quick to assert that LucidEra’s failure does not reflect a problem with the notion of on-demand BI in general. I agree, since I see the key to LucidEra's demise as its uniquely narrow focus on sales analysis. Indeed, competitors including Birst and GoodData have leapt to offer a new home to orphaned LucidEra clients.
Still, the apparently high costs to sustain a small client base suggests the economics of this business are not as attractive as they seem. LucidEra's Darren Cunningham did tell me that their costs were particularly high because they were not a multi-tenant solution and had to manage the entire BI stack to support a single application. Presumably other on-demand BI vendors can run more cheaply. Still there does seem to be a little more reason for caution in approaching on-demand BI vendors, even though there is not (yet) any cause for alarm.
Thursday, April 16, 2009
Lyzasoft: Independence for Analysts and Maybe Some Light on Shadow IT
Long-time readers of this blog know that I have a deep fondness for QlikView as a tool that lets business analysts do work that would otherwise require IT support. QlikView has a very fast, scalable database and excellent tools to create reports and graphs. But quite a few other systems offer at least one of these.*
What really sets QlikView apart is its scripting language, which lets analysts build processing streams to combine and transform multiple data sources. Although QlikView is far from comparable with enterprise-class data integration tools like Informatica, its scripts allow sophisticated data preparation that is vastly too complex to repeat regularly in Excel. (See my post What Makes QlikTech So Good for more on this.)
Lyzasoft Lyza is the first product I’ve seen that might give QlikView a serious run for its money. Lyza doesn’t have scripts, but users can achieve similar goals by building step-by-step process flows to merge and transform multiple data sources. The flows support different kinds of joins and Excel-style formulas, including if statements and comparisons to adjacent rows. This gives Lyza enough power to do most of the manipulations an analyst would want in cleaning and extending a data set.
Lyza also has the unique and important advantage of letting users view the actual data at every step in the flow, the way they’d see rows on a spreadsheet. This makes it vastly easier to build a flow that does what you want. The flows can also produce reports, including tables and different kinds of graphs, which would typically be the final result of an analysis project.
All of that is quite impressive and makes for a beautiful demonstration. But plenty of systems can do cool things on small volumes of data – basically, they throw the data into memory and go nuts. Everything about Lyza, from its cartoonish logo to its desktop-only deployment to the online store selling at a sub-$1,000 price point, led me to expect the same. I figured this would be another nice tool for little data sets – which to me means 50,000 to 100,000 rows – and nothing more.
But it seems that’s not the case. Lyzasoft CEO Scott Davis tells me the system regularly runs data sets with tens of millions of rows and the biggest he’s used is 591 million rows and around 7.5-8 GB.
A good part of the trick is that Lyza is NOT an in-memory database. This means it’s not bound by the workstation’s memory limits. Instead, Lyza uses a columnar structure with indexes on non-numeric fields. This lets it read required data from the disk very quickly. Davis also said that in practice most users either summarize or sample very large data sets early in their data flows to get down to more manageable volumes.
Summarizing the data seems a lot like cheating when you’re talking about scalability, so that didn’t leave me very convinced. But you can download a free 30 day trial of Lyza, which let me test it myself.
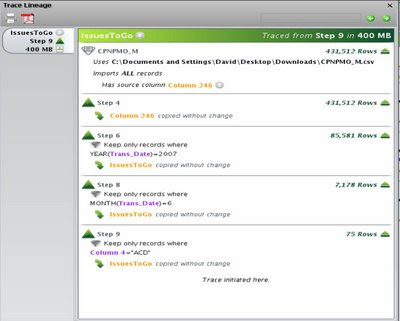
Bottom line: my embarrassingly ancient desktop (2.8 GHz CPU, 2 GB RAM, Windows XP) loaded a 400 MB CSV file with about 430,000 rows in just over 6 minutes. That’s somewhat painful, but it does suggest you could load 4 GB in an hour – a practical if not exactly desirable period. The real issue is that each subsequent step could take similar amounts of time: copying my 400 MB set to a second step took a little over 2 minutes and, more worrisome, subsequent filters took the same 2 minutes even though they reduced the record count to 85,000 then 7,000 then 50. This means a complete processing flow on a large data set could run for hours.
Still, a typical real-world scenario would be to do development work on small samples, and then only run a really big flow once you knew you had it right. So even the load time for subsequent steps is not necessarily a show-stopper.
Better news is that rerunning an existing filter with slightly different criteria took just a few seconds, and even rerunning the existing flow from the start was much faster than the first time through. Users can also rerun all steps after a given point in the flow. This works because Lyza saves the intermediate data sets. It means that analysts can efficiently explore changes or extend an existing project without waiting for the entire flow to re-execute. It’s not as nice as running everything on a lightning-fast data server, but most analysts would find it gives them all the power they need.
As a point of comparison, loading that same 400 MB CSV file took almost 11 minutes with QlikView. I had forgotten how slowly QlikView loads text files, particularly on my limited CPU. On the other hand, loading a 100 MB Excel spreadsheet took about 90 seconds for Lyza vs. 13 seconds in QlikView. QlikView also compressed the 400 MB to 22 MB on disk and about 50 MB in memory, whereas Lyza more than doubled data to 960 MB of disk, due mostly to indexes. Memory consumption in Lyza rose only about 10 MB.
Of course, compression ratios for both QlikView and Lyza depend greatly on the nature of the data. This particular set had lots of blanks and Y/N fields. The result was much more compression than I usually see in QlikView and, I suspect, more expansion than usual in Lyza. In general, Lyza seems to make little use of data compression, which is usually a key advantage of columnar databases. Although this seems like a problem today, it also means there's an obvious opportunity for improvement as the system finds itself dealing with larger data sets.
What I think this boils down to is that Lyza can effectively handle multi-gigabyte data volumes on a desktop system. The only reason I’m not being more definite is I did see a lot of pauses, most accompanied by 100% CPU utilization, and occasional spikes in memory usage that I could only resolve by closing the software and, once or twice, by rebooting. This happened when I was working with small files as well as the large ones. It might have been the auto-save function, my old hardware, crowded disk drives, or Windows XP. On the other hand, Lyza is a young product (released September 2008) with only a dozen or so clients, so bugs would not be surprising. I'm certainly not ready to say Lyza doesn't have them.
Tracking down bugs will be harder because Lyza also runs on Linux and Mac systems. In fact, judging by the Mac-like interface, I suspect it wasn't developed on a Windows platform. According to Davis, performance isn’t very sensitive to adding memory beyond 1 GB, but high speed disk drives do help once you get past 10 million rows or so. The absolute limit on a 32 bit system is about 2 billion rows, a constraint related to addressable memory space (2^31 = about 2 billion) rather than anything peculiar to Lyza. Lyza can also run on 64 bit servers and is certified on Intel multi-core systems.
Enough about scalability. I haven’t done justice to Lyza’s interface, which is quite good. Most actions involve dragging objects into place, whether to add a new step to a process flow, move a field from one flow stage to the next, or drop measures and dimensions onto a report layout. Being able to see the data and reports instantly is tremendously helpful when building a complex processing flow, particularly if you’re exploring the data or trying to understand a problem at the same time. This is exactly how most analysts work.
Lyza also provides basic statistical functions including descriptive statistics, correlation and Z-test scores, a mean vs. standard deviation plot, and stepwise regression. This is nothing for SAS or SPSS to worry about; in fact, even Excel has more options. But it’s enough for most purposes. Similarly, data visualization is limited compared to a Tableau or ADVIZOR, but allows some interactive analysis and is more than adequate for day-to-day purposes.
Users can combine several reports onto a single dashboard, adding titles and effects similar to a Powerpoint slide. The report remains connected to the original workflow but doesn’t update automatically when the flow is rerun.
Intriguingly, Lyza can also display the lineage of a table or chart value. It traces the data from its source through all subsequent workflow steps, listing any transformations or selections applied along the way. Davis sees this as quickly answering the ever-popular question, “Where did that number come from?” Presumably this will leave more time to discuss American Idol.
Users can also link one workflow to another by simply dragging an object onto a new worksheet. This is a very powerful feature, since it lets users break big workflows into pieces and lets one workflow feed data into several others. The company has just taken this one step further by adding a collaboration server, Lyza Commons, that lets different users share workflows and reports. Reports show which users send and receive data from other users, as well as which data sets send and receive information from other data sets.
Those reports are more than just neat: they're documenting data flows that are otherwise lost in the “shadow IT” which exists outside of formal systems in most organizations. Combined with lineage tracing, this is where IT departments and auditors should start to find Lyza really interesting.
A future version of Commons will also let non-Lyza users view Lyza reports over the Web – further extending Lyza beyond the analyst’s personal desktop to be an enterprise resource. Add in the 64-bit capability, an API to call Lyza from other systems, and some other tricks the company isn’t ready to discuss in public, and there’s potential here to be much more than a productivity tool for analysts.
This brings us back to pricing. If you were reading closely, you noticed that little comment about Lyza being priced under $1,000. Actually there are two versions: a $199 Lyza Lite that only loads from Microsoft Excel, Access and text files, and the $899 regular version that can also connect to standard relational databases and other ODBC sources and includes the API.
This isn’t quite as cheap as it sounds because these are one year subscriptions. But even so, it is an entry cost well below the several tens of thousands of dollars you’d pay to get started with full versions of QlikView or ADVIZOR, and even a little cheaper than Tableau. The strategy of using analysts’ desktop as a beachhead is obvious, but that doesn’t make it any less effective.
So, should my friends at QlikView be worried? Not right away – QlikView is a vastly more mature product with many features and capabilities that Lyza doesn’t match, and probably can’t unless it switches to an in-memory database. But analysts are QlikView’s beachhead too, and there’s probably not enough room on their desktops for both systems. With a much lower entry price and enough scalability, data manipulation and analysis features to meet analysts’ basic needs, Lyza could be the easier one to pick. And that would make QlikView's growth much harder.
----------------------------
*ADVIZOR Solutions and Tableau Software have excellent visualization with an in-memory database, although they’re not so scalable. PivotLink, Birst and LucidEra are on-demand systems that are highly scalable, although their visualization is less sophisticated. Here are links to my reviews: ADVIZOR , Tableau, PivotLink, Birst and LucidEra.
What really sets QlikView apart is its scripting language, which lets analysts build processing streams to combine and transform multiple data sources. Although QlikView is far from comparable with enterprise-class data integration tools like Informatica, its scripts allow sophisticated data preparation that is vastly too complex to repeat regularly in Excel. (See my post What Makes QlikTech So Good for more on this.)
Lyzasoft Lyza is the first product I’ve seen that might give QlikView a serious run for its money. Lyza doesn’t have scripts, but users can achieve similar goals by building step-by-step process flows to merge and transform multiple data sources. The flows support different kinds of joins and Excel-style formulas, including if statements and comparisons to adjacent rows. This gives Lyza enough power to do most of the manipulations an analyst would want in cleaning and extending a data set.
Lyza also has the unique and important advantage of letting users view the actual data at every step in the flow, the way they’d see rows on a spreadsheet. This makes it vastly easier to build a flow that does what you want. The flows can also produce reports, including tables and different kinds of graphs, which would typically be the final result of an analysis project.
All of that is quite impressive and makes for a beautiful demonstration. But plenty of systems can do cool things on small volumes of data – basically, they throw the data into memory and go nuts. Everything about Lyza, from its cartoonish logo to its desktop-only deployment to the online store selling at a sub-$1,000 price point, led me to expect the same. I figured this would be another nice tool for little data sets – which to me means 50,000 to 100,000 rows – and nothing more.
But it seems that’s not the case. Lyzasoft CEO Scott Davis tells me the system regularly runs data sets with tens of millions of rows and the biggest he’s used is 591 million rows and around 7.5-8 GB.
A good part of the trick is that Lyza is NOT an in-memory database. This means it’s not bound by the workstation’s memory limits. Instead, Lyza uses a columnar structure with indexes on non-numeric fields. This lets it read required data from the disk very quickly. Davis also said that in practice most users either summarize or sample very large data sets early in their data flows to get down to more manageable volumes.
Summarizing the data seems a lot like cheating when you’re talking about scalability, so that didn’t leave me very convinced. But you can download a free 30 day trial of Lyza, which let me test it myself.
Bottom line: my embarrassingly ancient desktop (2.8 GHz CPU, 2 GB RAM, Windows XP) loaded a 400 MB CSV file with about 430,000 rows in just over 6 minutes. That’s somewhat painful, but it does suggest you could load 4 GB in an hour – a practical if not exactly desirable period. The real issue is that each subsequent step could take similar amounts of time: copying my 400 MB set to a second step took a little over 2 minutes and, more worrisome, subsequent filters took the same 2 minutes even though they reduced the record count to 85,000 then 7,000 then 50. This means a complete processing flow on a large data set could run for hours.
Still, a typical real-world scenario would be to do development work on small samples, and then only run a really big flow once you knew you had it right. So even the load time for subsequent steps is not necessarily a show-stopper.
Better news is that rerunning an existing filter with slightly different criteria took just a few seconds, and even rerunning the existing flow from the start was much faster than the first time through. Users can also rerun all steps after a given point in the flow. This works because Lyza saves the intermediate data sets. It means that analysts can efficiently explore changes or extend an existing project without waiting for the entire flow to re-execute. It’s not as nice as running everything on a lightning-fast data server, but most analysts would find it gives them all the power they need.
As a point of comparison, loading that same 400 MB CSV file took almost 11 minutes with QlikView. I had forgotten how slowly QlikView loads text files, particularly on my limited CPU. On the other hand, loading a 100 MB Excel spreadsheet took about 90 seconds for Lyza vs. 13 seconds in QlikView. QlikView also compressed the 400 MB to 22 MB on disk and about 50 MB in memory, whereas Lyza more than doubled data to 960 MB of disk, due mostly to indexes. Memory consumption in Lyza rose only about 10 MB.
Of course, compression ratios for both QlikView and Lyza depend greatly on the nature of the data. This particular set had lots of blanks and Y/N fields. The result was much more compression than I usually see in QlikView and, I suspect, more expansion than usual in Lyza. In general, Lyza seems to make little use of data compression, which is usually a key advantage of columnar databases. Although this seems like a problem today, it also means there's an obvious opportunity for improvement as the system finds itself dealing with larger data sets.
What I think this boils down to is that Lyza can effectively handle multi-gigabyte data volumes on a desktop system. The only reason I’m not being more definite is I did see a lot of pauses, most accompanied by 100% CPU utilization, and occasional spikes in memory usage that I could only resolve by closing the software and, once or twice, by rebooting. This happened when I was working with small files as well as the large ones. It might have been the auto-save function, my old hardware, crowded disk drives, or Windows XP. On the other hand, Lyza is a young product (released September 2008) with only a dozen or so clients, so bugs would not be surprising. I'm certainly not ready to say Lyza doesn't have them.
Tracking down bugs will be harder because Lyza also runs on Linux and Mac systems. In fact, judging by the Mac-like interface, I suspect it wasn't developed on a Windows platform. According to Davis, performance isn’t very sensitive to adding memory beyond 1 GB, but high speed disk drives do help once you get past 10 million rows or so. The absolute limit on a 32 bit system is about 2 billion rows, a constraint related to addressable memory space (2^31 = about 2 billion) rather than anything peculiar to Lyza. Lyza can also run on 64 bit servers and is certified on Intel multi-core systems.
Enough about scalability. I haven’t done justice to Lyza’s interface, which is quite good. Most actions involve dragging objects into place, whether to add a new step to a process flow, move a field from one flow stage to the next, or drop measures and dimensions onto a report layout. Being able to see the data and reports instantly is tremendously helpful when building a complex processing flow, particularly if you’re exploring the data or trying to understand a problem at the same time. This is exactly how most analysts work.
Lyza also provides basic statistical functions including descriptive statistics, correlation and Z-test scores, a mean vs. standard deviation plot, and stepwise regression. This is nothing for SAS or SPSS to worry about; in fact, even Excel has more options. But it’s enough for most purposes. Similarly, data visualization is limited compared to a Tableau or ADVIZOR, but allows some interactive analysis and is more than adequate for day-to-day purposes.
Users can combine several reports onto a single dashboard, adding titles and effects similar to a Powerpoint slide. The report remains connected to the original workflow but doesn’t update automatically when the flow is rerun.
Intriguingly, Lyza can also display the lineage of a table or chart value. It traces the data from its source through all subsequent workflow steps, listing any transformations or selections applied along the way. Davis sees this as quickly answering the ever-popular question, “Where did that number come from?” Presumably this will leave more time to discuss American Idol.

Users can also link one workflow to another by simply dragging an object onto a new worksheet. This is a very powerful feature, since it lets users break big workflows into pieces and lets one workflow feed data into several others. The company has just taken this one step further by adding a collaboration server, Lyza Commons, that lets different users share workflows and reports. Reports show which users send and receive data from other users, as well as which data sets send and receive information from other data sets.
Those reports are more than just neat: they're documenting data flows that are otherwise lost in the “shadow IT” which exists outside of formal systems in most organizations. Combined with lineage tracing, this is where IT departments and auditors should start to find Lyza really interesting.
A future version of Commons will also let non-Lyza users view Lyza reports over the Web – further extending Lyza beyond the analyst’s personal desktop to be an enterprise resource. Add in the 64-bit capability, an API to call Lyza from other systems, and some other tricks the company isn’t ready to discuss in public, and there’s potential here to be much more than a productivity tool for analysts.
This brings us back to pricing. If you were reading closely, you noticed that little comment about Lyza being priced under $1,000. Actually there are two versions: a $199 Lyza Lite that only loads from Microsoft Excel, Access and text files, and the $899 regular version that can also connect to standard relational databases and other ODBC sources and includes the API.
This isn’t quite as cheap as it sounds because these are one year subscriptions. But even so, it is an entry cost well below the several tens of thousands of dollars you’d pay to get started with full versions of QlikView or ADVIZOR, and even a little cheaper than Tableau. The strategy of using analysts’ desktop as a beachhead is obvious, but that doesn’t make it any less effective.
So, should my friends at QlikView be worried? Not right away – QlikView is a vastly more mature product with many features and capabilities that Lyza doesn’t match, and probably can’t unless it switches to an in-memory database. But analysts are QlikView’s beachhead too, and there’s probably not enough room on their desktops for both systems. With a much lower entry price and enough scalability, data manipulation and analysis features to meet analysts’ basic needs, Lyza could be the easier one to pick. And that would make QlikView's growth much harder.
----------------------------
*ADVIZOR Solutions and Tableau Software have excellent visualization with an in-memory database, although they’re not so scalable. PivotLink, Birst and LucidEra are on-demand systems that are highly scalable, although their visualization is less sophisticated. Here are links to my reviews: ADVIZOR , Tableau, PivotLink, Birst and LucidEra.
Thursday, November 06, 2008
LucidEra and Birst Blaze New Trails for On-Demand BI
I spent a few minutes last week on the Web sites of about eight or nine on-demand business intelligence vendors, and within a few days received emails from two of them ostensibly asking about much earlier visits where I must have registered with my email address. Given my current obsession with demand generation systems, I’m pretty sure this was no coincidence: they had deposited a cookie linked to my email address during the earlier visit, and used this address to react when I returned. I suppose I should admire this as good marketing, although the disingenuousness of the messages was a bit disturbing. I suppose they felt that was better than the creepy feeling I might get if they said they knew I had visited. [Postscript: I later spoke with one of the salespeople, who sadly assured me it was a total coincidence. She only wished her firm could react so effectively.]
(I was about to coin the word “disingenuity” to mean something that is ingeniously disingenuous [i.e., cleverly deceptive], but see that the dictionary already lists it as a synonym for disingenuousness. Pity. )
Whatever. The reason I was looking at the on-demand BI sites was I’d spoken recently with two vendors in the field and wanted to get some context. One of the two was LucidEra , which was giving me an update since my post about them in July.
They’re doing quite well, thanks, and most excited about a new services offering they call a “pipeline healthcheck”. This is a standardized analysis of a company’s sales pipeline to find actionable insights. LucidEra says it has been tremendously successful in demonstrating the value of their system and thus closing sales. Apparently, many marketers never learned how to analyze the information buried within their sales automation systems, simply because it wasn’t available back when they were being trained. So doing it for them, and helping them learn to do it for themselves, adds great value.
This reinforced one of my few really profound insights into the software business, which is that the marketing software vendors who succeed have been the ones who provide extensive services to help their clients gain value from their systems. (Well, I think it's profound.) Interestingly, when I told LucidEra I have recently been applying this insight to demand generation vendors, they said they had recently switched to a new demand generation vendor and—this is the interesting part—found the new system was so much simpler to use that very little vendor support was necessary. That’s an interesting tidbit, although it doesn’t necessary confirm my service-is-essential thesis. Perhaps it needs a corollary of some sort when the applications are obvious or the users are already trained. Facts can be so pesky.
The other vendor on my mind was Birst. I actually spoke to them back in early September, but their product announcement was under embargo until September 30 and in any case I’ve been focused since then on the demand generation guide (have I mentioned http://www.raabguide.com/ yet today?) I’m glad to get back to Birst, though, because I was quite intrigued by what they showed me. Basically they claim to have fully automated the entire business intelligence implementation process: loading the data, designing the warehouse, identifying interesting information, and creating dashboards to display the results.
I’ll admit to being skeptical of how well they can do this, but the company’s managers have some excellent credentials and Birst itself is a project of a Success Metrics, which has been providing Web-based opportunity discovery to insurance and pharmaceutical sales forces since 2006. They offered me an online workspace to play with the tool, but I haven’t had time to take them up on it. (I think their Web site makes that same offer to anyone.)
I did spend a few minutes playing with a prebuilt demo on the Web site: it’s a reasonable user interface for ad hoc analysis and building dashboard reports. There was a lag of up to five seconds between each click when I was working with the data, which would quickly get annoying if I were trying to do real work. Part of the lag may be caused by the underlying technology, which generates relational OLAP cubes on the fly in response to user queries. But it also appears the system uses a traditional Web interface, which redraws the screen after each click, rather than AJAX and similar technologies which provide a smoother, faster user experience.
I don’t want to dwell on the Birst user interface, partly because I haven’t tested it thoroughly and partly because you can judge it for yourself, but mostly because their more important claim is the automated implementation. As I said last March, I think the labor involved with building the system is the biggest obstacle to on-demand BI, so Birst’s claim to have solved this is the real news.
It would take some serious testing to assess how good a job Birst’s automated systems can really do. Still, the system can be useful even if it’s not perfect and it will presumably improve over time. So if you’re thinking about on-demand business intelligence, either for a specific purpose or just to better understand what’s possible, Birst is certainly worth a look.
Incidentally, my quick scan of other on-demand business intelligence vendors (Autometrics, BlinkLogic, Good Data, oco, OnDemandIQ, and PivotLink) showed that only oco made a similar claim about having automated the implementation process.
On the other hand, Good Data, PivotLink LucidEra and possibly oco are using in-memory or columnar databases (PivotLink’s is in-memory and columnar: they win). In theory these should give quicker response than Birst’s on-the-fly OLAP cubes, although actual performance depends on the implementation details. (Speaking of experience, Birst’s database technology has been running at Success Metrics for several years, and has scaled to the terabyte range. I don’t know what scales the other vendors have reached.) It also seems to me that in-memory and columnar databases should be particularly compatible with automated implementation because their simpler structures and greater efficiency make them more forgiving than conventional databases if the automated design is less than optimal. But no one in this particular group of vendors seems to have put the two together.
I don’t know when I’ll have time to give all these other vendors the attention they deserve. But based on what I’ve heard from LucidEra and Birst, and seen on the other vendors’ Web sites, I’m more optimistic about the potential of on-demand business intelligence than I was back in March.
Thursday, July 03, 2008
LucidEra Takes a Shot at On-Demand Analytics
Back in March, I wrote a fairly dismissive post about on-demand business intelligence systems. My basic objection was that the hardest part of building a business intelligence system is integrating the source data, and being on-demand doesn’t make that any easier. I still think that’s the case, but did revisit the topic recently in a conversation with Ken Rudin, CEO of on-demand business analytics vendor Lucid Era.
Rudin, who has plenty of experience with both on-demand and analytics from working at Salesforce.com, Siebel, and Oracle, saw not one but two obstacles to business intelligence: integration and customization. He described LucidEra’s approach as not so much solving those problems as side-stepping them.
The key to this approach is (drum roll…) applications. Although LucidEra has built a platform that supports generic on-demand business intelligence, it doesn’t sell the platform. Rather, it sells preconfigured applications that use the platform for specific purposes including sales pipeline analysis, order analysis, and (just released) sales lead analysis. These are supported by standard connectors to Salesforce.com, NetSuite (where Rudin was an advisory board member) and Oracle Order Management.
Problem(s) solved, eh? Standard applications meet customer needs without custom development (at least initially). Standard connectors integrate source data without any effort at all. Add the quick deployment and scalability inherent in the on-demand approach, and, presto, instant business value.
There’s really nothing to argue with here, except to point out that applications based on ‘integrating’ data from a single source system can easily be replaced by improvements to the source system itself. LucidEra fully recognizes this risk, and has actually built its platform to import and consolidate data from multiple sources. In fact, the preconfigured applications are just a stepping stone. The company’s long-term strategy is to expose its platform so that other people can build their own applications with it. This would certainly give it a more defensible business position. Of course, it also resurrects the customization and integration issues that the application-based strategy was intended to avoid.
LucidEra would probably argue that its technology makes this customization and integration easier than with alternative solutions. My inner database geek was excited to learn that the company uses a version of the columnar database originally developed by Broadbase (later merged with Kana), which is now open source LucidDB. An open source columnar database—how cool is that?
LucidEra also uses the open source Mondrian OLAP server (part of Pentaho) and a powerful matching engine for identity resolution. These all run on a Linux grid. There is also some technology—which Rudin said was patented, although I couldn’t find any details—that allows applications to incorporate new data without customization, through propagation of metadata changes. I don’t have much of an inner metadata geek, but if I did, he would probably find that exciting too.
This all sounds technically most excellent and highly economical. Whether it significantly reduces the cost of customization and integration is another question. If it allows non-IT people to do the work, it just might. Otherwise, it’s the same old development cycle, which is no fun at all.
So, as I said at the start of all this, I’m still skeptical of on-demand business intelligence. But LucidEra itself does seem to offer good value.
My discussion with LucidEra also touched on a couple of other topics that have been on my mind for some time. I might as well put them into writing so I can freely enjoy the weekend.
- Standard vs. custom selection of marketing metrics. The question here is simply whether standard metrics make sense. Maybe it’s not a question at all: every application presents them, and every marketer asks for them, usually in terms of “best practices”. It’s only an issue because when I think about this as a consultant, and when I listen to other consultants, the answer that comes back is that metrics should be tailored to the business situation. Consider, for example, choosing Key Performance Indicators on a Balanced Scorecard. But vox populi, vox dei (irony alert!), so I suppose I’ll have to start defining a standard set of my own.
- Campaign analysis in demand generation systems. This came up in last week’s post and the subsequent comments, which I highly recommend that you read. (There may be a quiz.) The question here is whether most demand generation systems (Eloqua, Vtrenz, Marketo, Market2Lead, Manticore, etc.) import sales results from CRM systems to measure campaign effectiveness. My impression was they did, but Rudin said that LucidEra created its lead analysis system precisely because they did not. I’ve now carefully reviewed my notes on this topic, and can tell you that Marketo and Market2Lead currently have this capability, while the other vendors I’ve listed should have it before the end of the year. So things are not quite as rosy as I thought but will soon be just fine.
Tuesday, June 10, 2008
Marketo Aims to Simplify Demand Generation
As I wrote last week, demand generation vendors have a hard time differentiating their systems from each other. One company that has made a concerted effort is newcomer Marketo. Marketo has a one-word elevator speech: simplicity.
That’s not to say Marketo is a simple product. Functionally, it covers all the demand generation bases: outbound email, landing pages, Web site monitoring, lead scoring, multi-step nurturing programs, prospect database, analytics, Salesforce.com integration. It even adds A/B testing for landing pages, which you don’t see everywhere. The depth in each area is perfectly respectable as well.
Where simplicity comes in is the user interface. Like every other demand generation vendor, Marketo has wrestled with how a branching, multi-step lead nurturing campaign can be made easy enough for non-specialist users. The traditional approach has been a flow chart with lines and boxes. This is, after all, the way “real” process diagrams are built by programmers and engineers. It does express the logic of each flow precisely, but it also can get incomprehensibly complex very quickly.
Marketo’s solution is to do away with the branches. Each campaign flow is presented as a list, and any deviation from the sequence is treated as a diversion to another flow. The list itself can be presented in a collapsed format with each step as a numbered item, or an expanded format where the actions taken at each step are exposed. (Or, users can expand a single step at a time.) Actions include adding or removing the lead from a list, changing a data value or score, sending an email, moving the lead to a different flow, removing it from all flows, and waiting a specified period of time. The system can also add the lead to a Salesforce.com database, assign or change the owner in Salesforce.com, and create a Salesforce.com task. Each action can be associated with a set of conditions that determine whether or not it is executed. One step can include multiple actions, each with its own conditions. The system can be told to execute only the first action whose execution conditions are met, which is one way to implement branching logic .
Other components of Marketo are more conventional, although still designed with simplicity in mind. Users can set up Web landing pages and email templates using a drag-and-drop interface modeled on PowerPoint—the one tool, as Marketo points out, that every marketer is guaranteed to know how to use. These templates can include variables selected from the Marketo database for personalization. Users can also create forms to capture data provided by site visitors or read automatically from the form or URL parameters. Forms can be reused across campaigns.
Campaign lists are built with another drag-and-drop interface, allowing users to layer multiple selection conditions. These can be based on lead data and constraints such as Web search terms, event frequency, and date ranges. Lists can be frozen after selection or dynamically refreshed each time they are used. Users can review the members of a list and click on a name to see its details, including the log of messages sent and activities recorded in Marketo. Like other demand generation systems, Marketo uses cookies to track the behavior of anonymous Web visitors and merge these into the lead record if the visitor later identifies herself. Lead scores are calculated by adding or subtracting points for user-specified behaviors. These values can automatically be reduced as time passes after an event.
Leads can also enter a campaign through triggers. Trigger events can include clicking on a link, filling out a form, changing a data value, creating a new lead record, and being added to a list. The system reacts to triggers as soon as they happen, rather than waiting for lists to be updated.
Campaigns can be scheduled to run once or at regular intervals. So can the wide range of standard reports covering, covering campaign results, email performance, Web activity and lead statistics. Users can run a report against a specified list and can have a report automatically emailed to them on a regular basis. A custom report builder is due by the end of July.
Marketo’s integration with Salesforce.com also bolsters its claim to simplicity. The system feeds data to Salesforce in real time and receives data from Salesforce every five minutes. This will go to real time as soon as Salesforce permits it. The integration is based on the Salesforce Force.com platform, which allows new installations of Marketo to connect with Salesforce in minutes. It also allows Marketo fields to appear within the regular Salesforce tabs, instead of a tab of its own. The lead activity summary from Marketo does appear separately within Salesforce.
It more or less goes without saying that Marketo is sold as a hosted service. This, combined with the automatic Salesforce.com integration, enables new clients to get started very quickly. The company cited implementations in as little as 24 hours, although I’m not sure this is a standard promise. They do say users become proficient after two hours of training. Perhaps the most convincing evidence that the system is easy to install is that the company doesn’t charge a separate set-up fee—definitely not something all its competitors can say.
In fact, Marketo pricing is about as simple as it gets: a straight monthly fee ranging from $1,500 to $10,000 depending on the number of leads, page views and email contacts.
Marketo was founded in late 2005 by veterans of Epiphany. Its leaders spent the first two years researching market requirements and raising capital. They officially launched the Marketo product in March of this year and now have about 35 clients. These are primarily mid-to-large business-to-business marketers.
Friday, June 06, 2008
Oh, the Irony! Do Demand Generation Vendors Have A Sound Marketing Strategy?
There are literally dozens of vendors offering “demand generation” software, which can be roughly defined as systems to generate and nurture leads before turning them over to sales. Their function lists usually sound pretty much alike: outbound email campaigns to generate leads; Web landing pages to capture responses; lead scoring to determine how to treat them; multi-step email campaigns to nurture them; integration with sales automation systems; and analytics to track the results.
It’s a situation that cries out for vendors to specialize in different customer segments, but so far the only division along those lines seems to be that some vendors focus on small businesses while others target mid-size and larger organizations. If anyone has taken the obvious next step of creating vertical packages for specific industries, I haven’t seen it. (Of course, given how many vendors there are and the fact that I do like to sleep occasionally, it’s quite possible that these do exist.)
My guess, however, is that most competitors in this market (and their financial backers) are not yet ready to give up the dream of being the dominant player in a single, unified industry. The generic approach may also reflect the origins of many vendors in technologies like Web analytics and email campaigns, which themselves have not fragmented into vertical specialties. And I suppose the underlying features required for demand generation are in fact largely the same across most segments, so there is little technical reason to specialize.
One implication of this is that resellers, who do tend to specialize by industry, will play an important role in making these systems work for most users. This is what happened with sales automation software. If I’m correct, then the demand generation vendors should be competing aggressively to attract reseller support. I can’t say I’ve seen much of that either—so, again, maybe I’ve missed it. Or maybe deployment of these systems is so simple that resellers can’t make any money doing it. If that were the case—and I’m not convinced it is—then we’d expect vendors who already assist marketers, such as advertising and publicity agencies, to offer the tools as an extension of their own services. I’ve seen a bit of that, but it doesn’t seem to be the main strategy the demand generation vendors are pursuing.
So if demand generation vendors are not staking out vertical specialties or pursuing channel partners, just how do they seem to compete? Many show a reassuring confidence in their own systems, running exactly the sorts of lead generation and nurturing programs they are proposing for others. These are, or should be, coupled with attempts to build superior sales organizations that will close the leads the systems generate. Perhaps this sort of ferocious, nuts-and-bolts approach to sales and marketing is all they really need to win.
And yet, it would be more than a little ironic if companies that hope to sell to marketers were themselves ignoring the strategic marketing issues of branding, differentiation and segmentation. Ironic, but not inconceivable: the demand generation vendors are after all business-to-business marketers, selling primarily to other business marketers, who often pay much less attention to the grand marketing strategies than their consumer marketing counterparts. For better or worse, many business marketers focus primarily on product features and technologies, despite ample historical evidence that the best product does not always win. It should not be surprising that many demand generation marketing programs take a similar approach.
That said, some demand generation systems do seem to have a clearer approach to positioning themselves in the market. This post was going to profile one such vendor. But the preceding introduction ran on for so long that I think I’ll write about that vendor in a separate post next week instead. After all, it’s a Friday afternoon in the summer. Enjoy your weekend.
Wednesday, April 09, 2008
Bah, Humbug: Let's Not Forget the True Meaning of On-Demand
I was skeptical the other day about the significance of on-demand business intelligence. I still am. But I’ve also been thinking about the related notion of on-demand predictive modeling. True on-demand modeling – which to me means the client sends a pile of data and gets back a scored customer or prospect list – faces the same obstacle as on-demand BI: the need for careful data preparation. Any modeler will tell you that fully automated systems make errors that would be obvious to a knowledgeable human. Call it the Sorcerer’s Apprentice effect.
Indeed, if you Google “on demand predictive model”, you will find just a handful of vendors, including CopperKey, Genalytics and Angoss. None of these provides the generic “data in, scores out” service I have in mind. There are, however, some intriguing similarities among them. Both CopperKey and Genalytics match the input data against national consumer and business databases. Both Angoss and CopperKey offer scoring plug-ins to Salesforce.com. Both Genalytics and Angoss will also build custom models using human experts.
I’ll infer from this that the state of the art simply does not support unsupervised development of generic predictive models. Either you need human supervision, or you need standardized inputs (e.g., Salesforce.com data), or you must supplement the data with known variables (e.g. third-party databases).
Still, I wonder if there is an opportunity. I was playing around recently with a very simple, very robust scoring method a statistician showed me more than twenty years ago. (Sum of Z-scores on binary variables, if you care.) This did a reasonably good job of predicting product ownership in my test data. More to the point, the combined modeling-and-scoring process needed just a couple dozen lines of code in QlikView. It might have been a bit harder in other systems, given how powerful QlikView is. But it’s really quite simple regardless.
The only requirements are that the input contains a single record for each customer and that all variables are coded as 1 or 0. Within those constraints, any kind of inputs are usable and any kind of outcome can be predicted. The output is a score that ranks the records by their likelihood of meeting the target condition.
Now, I’m fully aware that better models can be produced with more data preparation and human experts. But there must be many situations where an approximate ranking would be useful if it could be produced in minutes with no prior investment for a couple hundred dollars. That's exactly what this approach makes possible: since the process is fully automated, the incremental cost is basically zero. Pricing would only need to cover overhead, marketing and customer support.
The closest analogy I can think of among existing products are on-demand customer data integration sites. These also take customer lists submitted over the Internet and automatically return enhanced versions – in their case, IDs that link duplicates, postal coding, and sometimes third-party demograhpics and other information. Come to think of it, similar services perform on-line credit checks. Those have proven to be viable businesses, so the fundamental idea is not crazy.
Whether on-demand generic scoring is also viable, I can’t really say. It’s not a business I am likely to pursue. But I think it illustrates that on-demand systems can provide value by letting customers do things with no prior setup. Many software-as-a-service vendors stress other advantages: lower cost of ownership, lack of capital investment, easy remote access, openness to external integration, and so on. These are all important in particular situations. But I’d also like to see vendors explore the niches where “no prior setup and no setup cost” offers the greatest value of all.
Thursday, March 27, 2008
The Limits of On-Demand Business Intelligence
I had an email yesterday from Blink Logic , which offers on-demand business intelligence. That could mean quite a few things but the most likely definition is indeed what Blink Logic provides: remote access to business intelligence software loaded with your own data. I looked a bit further and it appears Blink Logic does this with conventional technologies, primarily Microsoft SQL Server Analysis Services and Cognos Series 7.
At that point I pretty much lost interest because (a) there’s no exotic technology, (b) quite a few vendors offer similar services*, and (c) the real issue with business intelligence is the work required to prepare the data for analysis, which doesn’t change just because the system is hosted.
Now, this might be unfair to Blink Logic, which could have some technology of its own for data loading or the user interface. It does claim that at least one collaboration feature, direct annotation of data in reports, is unique. But the major point remains: Blink Logic and other “on-demand business intelligence” vendors are simply offering a hosted version of standard business intelligence systems. Does anyone truly think the location of the data center is the chief reason that business intelligence has so few users?
As I see it, the real obstacle is that most source data must be integrated and restructured before business intelligence systems can use it. It may be literally true that hosted business intelligence systems can be deployed in days and users can build dashboards in minutes, but this only applies given the heroic assumption that the proper data is already available. Under those conditions, on-premise systems can be deployed and used just as quickly. Hosting per se has little benefit when it comes to speed of deployment. (Well, maybe some: it can take days or even a week or two to set up a new server in some corporate data centers. Still, that is a tiny fraction of the typical project schedule.)
If hosting isn't the answer, what can make true “business intelligence on demand” a reality? Since the major obstacle is data preparation, then anything that allows less preparation will help. This brings us back to the analytical databases and appliances I’ve been writing about recently : Alterian, Vertica, ParAccel, QlikView, Netezza and so on. At least some of them do reduce the need for preparation because they let users query raw data without restructuring it or aggregating it. This isn’t because they avoid SQL queries, but because they offer a great enough performance boost over conventional databases that aggregation or denormalization are not necessary to return results quickly.
Of course, performance alone can’t solve all data preparation problems. The really knotty challenges like customer data integration and data quality still remain. Perhaps some of those will be addressed by making data accessible as a service (see last week’s post). But services themselves do not appear automatically, so a business intelligence application that requires a new service will still need advance planning. Where services will help is when business intelligence users can take advantage of services created for operational purposes.
“On demand business intelligence” also requires that end-users be able to do more for themselves. I actually feel this is one area where conventional technology is largely adequate: although systems could always be easier, end-users willing to invest a bit of time can already create useful dashboards, reports and analyses without deep technical skills. There are still substantial limits to what can be done – this is where QlikView’s scripting and macro capabilities really add value by giving still more power to non-technical users (or, more precisely, to power users outside the IT department). Still, I’d say that when the necessary data is available, existing business intelligence tools let users accomplish most of what they want.
If there is an issue in this area, it’s that SQL-based analytical databases don’t usually include an end-user access tool. (Non-SQL systems do provide such tools, since users have no alternatives.) This is a reasonable business decision on their part, both because many firms have already selected a standard access tool and because the vendors don’t want to invest in a peripheral technology. But not having an integrated access tool means clients must take time to connect the database to another product, which does slow things down. Apparently I'm not the only person to notice this: some of the analytical vendors are now developing partnerships with access tool vendors. If they can automate the relationship so that data sources become visible in the access tool as soon as they are added to the analytical system, this will move “on demand business intelligence” one step closer to reality.
* results of a quick Google search: OnDemandIQ, LucidEra, PivotLink (an in-memory columnar database), oco, VisualSmart, GoodData and
Autometrics.
Thursday, December 06, 2007
1010data Offers A Powerful Columnar Database
Back in October I wrote here about the resurgent interest in alternatives to standard relational databases for analytical applications. Vendors on my list included Alterian, BlueVenn (formerly SmartFocus), Vertica and QD Technology. Most use some form of a columnar structure, meaning data is stored so the system can load only the columns required for a particular query. This reduces the total amount of data read from disk and therefore improves performance. Since a typical analytical query might read only a half-dozen columns out of hundreds or even thousands available, the savings can be tremendous.
I recently learned about another columnar database, Tenbase from 1010data. Tenbase, introduced in 2000, turns out to be a worthy alternative to better-known columnar products.
Like other columnar systems, Tenbase is fast: an initial query against a 4.3 billion row, 305 gigabyte table came back in about 12 seconds. Subsequent queries against the results were virtually instantaneous, because they were limited to the selected data and that data had been moved into memory. Although in-memory queries will always be faster, Tenbase says reading from disk takes only three times as long, which is a very low ratio. The reflects a focused effort by the company to make disk access as quick as possible.
What’s particularly intriguing is Tenbase achieves this performance without compressing, aggregating or restructuring the input. Although indexes are used in some situations, queries generally read the actual data. Even with indexes, the Tenbase files usually occupy about the same amount of space as the input. This factor varies widely among columnar databases, which sometimes expand file size significantly and sometimes compress it. Tenbase also handles very large data sets: the largest in production is nearly 60 billion rows and 4.6 terabytes. Fast response on such large installations is maintained by adding servers that process queries in parallel. Each server contains a complete copy of the full data set.
Tenbase can import data from text files or connect directly to multi-table relational databases. Load speed is about 30 million observations per minute for fixed width data. Depending on the details, this comes to around 10 gigabytes per hour. Time for incremental loads, which add new data to an existing table, is determined only by the volume of the new data. Some columnar databases essentially reload the entire file during an ‘incremental’ update.
Regardless of the physical organization, Tenbase presents loaded data as if it were in the tables of a conventional relational database. Multiple tables can be linked on different keys and queried. This contrasts with some columnar systems that require all tables be linked on the same key, such as a customer ID.
Tenbase has an ODBC connector that lets it accept standard SQL queries. Results come back as quickly as queries in the system’s own query language. This is also special: some columnar systems run SQL queries much more slowly or won’t accept them at all. The Tenbase developers demonstrated this feature by querying a 500 million row database through Microsoft Access, which feels a little like opening the door to a closet and finding yourself in the Sahara desert.
Tenbase’s own query language is considerably more powerful than SQL. It gives users advanced functions for time-series analysis, which actually allows many types of comparisons between rows in the data set. It also contains a variety of statistical, aggregation and calculation functions. It’s still set-based rather than a procedural programming language, so it doesn't support features like if/then loops. This is one area where some other columnar databases may have an edge.
The Tenbase query interface is rather plain but it does let users pick the columns and values to select by, and the columns and summary types to include in the result. Users can also specify a reference column for calculations such as weighted averages. Results can be viewed as tables, charts or cross tabs (limited to one value per intersection), which can themselves be queried. Outputs can be exported in Excel, PDF, XML, text or CSV formats. The interface also lets users create calculated columns and define links among tables.
Under the covers, the Tenbase interface automatically creates XML statements written to the Tenbase API. Users can view and edit the XML or write their own statements from scratch. This lets them create alternate interfaces for special purposes or simply to improve the esthetics. Queries built in Tenbase can be saved and rerun either in their original form or with options for users to enter new values at run time. The latter feature gives a simple way to build query applications for casual users.
The user interface is browser-based, so no desktop client is needed. Perhaps I'm easily impressed, but I like that the browser back button actually works. This is often not the case in such systems. Performance depends on the amount of data and query complexity but it scales with the number of servers, so even very demanding queries against huge databases can be returned in a few minutes with the right hardware. The servers themselves are commodity Windows PCs. Simple queries generally come back in seconds.
Tenbase clients pay for the system on a monthly basis. Fees are based primarily on the number of servers, which is determined by the number of users, amount of data, types of queries, and other details. The company does not publish its pricing but the figures it mentioned seemed competitive. The servers can reside at 1010data or at the client, although the 1010data will manage them either way. Users can load data themselves no matter where the server is located.
Most Tenbase clients are in the securities industry, where the product is used for complex analytics. The company has recently added several customers in retail, consumer goods and health care. There are about 45 active Tenbase installations, including the New York Stock Exchange, Proctor & Gamble and Pathmark Stores.
Thursday, June 14, 2007
Hosted Software Enters the Down Side of the Hype Cycle
“SMB SaaS sales robust, but holdouts remain” reads the headline on a piece from SearchSMB.com Website. (For the acronym impaired, SMB is “small and medium sized business” and SaaS is “software as a service”, a.k.a. hosted systems.) The article quotes two recent surveys, one by Saugatuck Technology and the other by Gartner. According to the article, Saugatuck found “SMB adoption rose from 9% in 2006 to 27% in 2007” among businesses under $1 billion in revenue, while Gartner reported “Only 7% of SMBs strongly believed that SaaS was suitable for their organizations, and only 17% said they would consider SaaS when its adoption became more widespread.”
These seem to be conflicting findings, although it’s impossible to know for certain without looking at the actual surveys and their audiences. But the very appearance of the piece suggests some of the bloom is off the SaaS rose. This is a normal stage in the hype cycle and frankly I’ve been anticipating it for some time. The more interesting question is why SMBs would be reluctant to adopt SaaS.
The article quotes Gartner Vice President and Research Director James Browning as blaming the fact that “SMBs are control freaks” and therefore less willing to trust their data to an outsider than larger, presumably more sophisticated entities. Maybe—although I’ve seen plenty of control freaks at big companies too. The article also mentions difficulties with customization and integration. Again, I suspect that’s a contributing factor but probably not the main one.
A more convincing insight came from an actual SMB manager, who pointed to quality of service issues and higher costs than in-house systems. I personally suspect the cost issue is the real one: whether or not they’re control freaks, SMBs are definitely penny-pinchers. That’s what happens when it’s your own money. (I say this as someone who’s run my own Very Small Business for many years.) On a more detailed financial level, SMBs have less formal capital appropriation processes than big companies, so their managers have less incentive to avoid the capital expense by purchasing SaaS products through their operating budgets.
One point the article doesn’t mention is that SaaS prices have gone up considerably, at least among the major vendors. This shifts the economics in favor of in-house systems, particularly since many SMBs can use low cost products that larger companies would not accept. This pricing shift makes sense from the vendors’ standpoint: as SaaS is accepted at larger companies with deeper pockets, it makes sense to raise prices to match. Small businesses may need to look beyond the market leaders to find pricing they can afford.
Monday, May 21, 2007
Everest Software Balances Hosted and On-Demand
The public debate between on-premise and on-demand (hosted) software has largely been won by the on-demand side, particularly where small businesses are concerned. Faster, cheaper and easier deployment seems an overwhelming advantage, even though on-demand long-term costs may be higher, integration more difficult, and functionality not quite as rich as for on-premise systems.
And yet—plenty of on-premise software is still sold. In fact, although I haven’t seen actual figures, I suspect on-premise continues to hold a larger share of the market. Small businesses are reluctant to make a change, so they’re likely to stick with their existing systems and incremental upgrades as long as possible. In addition, many small business owners (and here I speak from personal experience) prefer to have as much control as possible over their business operations, and find the notion of such heavy reliance on a remote system to be distasteful.
Everest Software produced a good white paper summarizing the issues, “On-Demand vs. On-Premise Software Deployment”, available here (registration required). Everest provides enterprise management software (everything from CRM to ecommerce to inventory and accounting) for small businesses. It offers both on-premise and on-demand options, so its paper is free to present a balanced view of the choices.
I have just two factual quibbles with the paper. One is it assumes on-premise systems have richer user interfaces: although this was true in early implementations, today technologies such as AJAX allow even purely browser-based hosted system to provide pretty much the same interface as systems that install local software. The other is the statement, repeated twice, that “after a period of three to five years, many businesses achieve a lower total cost of ownership with On-Premise software deployments (exclusive of personnel costs).” This might be literally correct, but personnel costs can’t really be excluded. Once you count them in, on-demand systems are very likely cheaper in the long run as well as the short run for many small businesses.
In any event, long-run total cost of ownership is unlikely to be a key issue for most small businesses. Capital tends to be scarce at such firms, so the smaller up-front investment of on-demand is a more compelling consideration. Again, I suspect the real obstacles to on-demand are the emotional one of control and the practical one of integration. Of those, integration is really the key. This won’t be solved by publishing APIs, as some hosted vendors seem to hope, because most small businesses lack the technical resources needed to take advantage of APIs. We’ll see whether simpler integration capabilities become available, similar to “mash up” features now available on some consumer Web sites. If I were a hosted software developer, that’s where I’d put my energy.
Subscribe to:
Posts (Atom)


