As I mentioned a couple of posts back, I’ve been surveying the borders of Customer Data Platform-land recently, trying to figure out which vendors fit within the category and which do not. Naturally, there are cases where the answer isn’t clear. Datorama is one of them.
At first glance, you’d think Datorama is definitely not a CDP: it positions itself as a “marketing analytics platform” and makes clear that its primary clients are agencies, publishers, and corporate marketers who want to measure advertising performance. But the company also calls itself a “marketing integration engine” that works with “all of your data”, which certainly goes beyond just advertising. Dig a bit deeper and the confusion just grows: the company works mostly with aggregated performance data, but also works with some individual-level data. It doesn’t currently do identity resolution to build unified customer profiles, but is moving in that direction. And it integrates with advertising and Web analytics data on one hand and social listening, marketing automation, and CRM on the other. So while Datorama wasn’t built to be a CDP – because unified customer profiles are the core CDP feature – it may be evolving towards one.
This isn't to say that Datorama lacks focus. The system was introduced in 2012 and now has over 2,000 clients, including brands, agencies, and publishers. It grew by solving a very specific problem: the challenges that advertisers and publishers face in combining information about ad placements and results. Its solution was to automate every step of the marketing measurement process as much as it could, using machine intelligence to identify information within new data sources, map those to a standard data model, present the results in dashboards, and uncover opportunities for improvement. In other words, Datorama gives marketers one system for everything from data ingestion to consolidation to delivery to analytics. This lets them manage a process that would otherwise require many different products and lots of technical support. That approach – putting marketers in control by giving them a system pre-tailored to their needs – is very much the CDP strategy.
Paradoxically, the main result of Datorama’s specialization is flexibility. The system’s developers set of goal of handling any data source, which led to a system that can ingest nearly any database type, API feed or file format, including JSON and XML; automatically identify the contents of each field; and map the fields to the standard data model. Datorama keeps track of what it learns about common source systems, like Facebook, Adobe Analytics, or AppNexus, making it better at mapping those sources for future implementations. It can also clean, transform, classify, and reformat the inputs to make them more usable, applying advanced features like rules, formulas, and sentiment analysis. At the other end of the process, machine learning builds predictive models to do things like estimate lifetime value and forecast campaign results. The results can be displayed in Datorama’s own interface, read by business intelligence products like Tableau, or exported to other systems like marketing automation.
Datorama’s extensive use of machine learning lets it speed up the marketing analytics process while reducing the cost. But this is still not a push-button solution. The vendor says a typical proof of concept usually takes about one month, and it takes another one to two months more to convert the proof of concept into a production deployment. That’s faster than your father’s data warehouse but not like adding an app to your iPhone. Pricing is also non-trivial: a small company will pay in the five figures for a year’s service and a large company's bill could reach into seven figures. Fees are based on data volume and number of users. Datorama can also provide services to help users get set up or to run the system for them if they prefer.
Showing posts with label marketing performance measurement. Show all posts
Showing posts with label marketing performance measurement. Show all posts
Friday, October 14, 2016


Thursday, August 25, 2016
ABM Vendor Guide: Differentiators for Result Analysis
...and we wrap up our review of sub-functions from the Raab Guide to ABM Vendors with a look at Result Analysis.
As the Guide points out, this category focuses on measurements unique to account-based programs:
Nearly every system will have some form of result reporting. ABM specialists provide account-based result metrics such as percentage of target accounts reached, amount of time target accounts are spending with company messages, and distribution of messages by department within target accounts.
Not surprisingly, most of vendors who do ABM Result Analysis also do some sort of Execution (12 out of 16, to be exact). Another two (Everstring and ZenIQ) didn't fall into the Execution group but came close. Of the final two, one supports measurement with advanced lead-to-account mapping (LeanData) and one attribution specialist (Bizible). It's important to recognize that many of the Execution vendors will report only results of their own messages. This is certainly helpful but you'll want to see reports that combine data from all messages to get a meaningful picture of your ABM program results.
Differenatiators for this group include:
ABM Process
|
System Function
|
Sub-Function
|
Number of
Vendors
|
Identify Target Accounts
|
Assemble Data
|
External Data
|
28
|
Select
Targets
|
Target
Scoring
|
15
|
|
Plan Interactions
|
Assemble Messages
|
Customized Messages
|
6
|
Select Messages
|
State-Based Flows
|
10
|
|
Execute Interactions
|
Deliver Messages
|
Execution
|
19
|
Analyze Results
|
Reporting
|
Result Analysis
|
16
|
As the Guide points out, this category focuses on measurements unique to account-based programs:
Nearly every system will have some form of result reporting. ABM specialists provide account-based result metrics such as percentage of target accounts reached, amount of time target accounts are spending with company messages, and distribution of messages by department within target accounts.
Not surprisingly, most of vendors who do ABM Result Analysis also do some sort of Execution (12 out of 16, to be exact). Another two (Everstring and ZenIQ) didn't fall into the Execution group but came close. Of the final two, one supports measurement with advanced lead-to-account mapping (LeanData) and one attribution specialist (Bizible). It's important to recognize that many of the Execution vendors will report only results of their own messages. This is certainly helpful but you'll want to see reports that combine data from all messages to get a meaningful picture of your ABM program results.
Differenatiators for this group include:
- lead-to-account mapping to unify data
- corporate hierarchy mapping (headquarters/branch, parent/subsidiary, etc.) to unify data
- marketing campaign to opportunity mapping to support attribution
- combine data from marketing automation, Web analytics, and CRM
- track offline channels such as conferences, direct mail, outbound hone calls
- capture detailed interaction history for each Web visit (mouse clicks, scrolling, active time spent, etc.)
- capture mobile app behaviors with SDK as well as Web site behaviors with Javascript tag
- use device ID to link display ads, Web site visits, and form fills to revenue, even when visitors don’t click on ad or Web page
- report within Salesforce CRM on combined information about leads, contacts, accounts, opportunities, campaigns, and owners
- apply multiple attribution methods including first touch, last touch, fractional, etc.
- show account-level descriptive metrics including coverage, contact frequency, visitors, contacts by job title
- show account-level result metrics including reach, engagement, influence, velocity
- show reach, engagement, influence, velocity by campaign, content, persona, segment, etc.
- identify gaps in coverage, reach, or engagement by account and recommend corrective actions
- introduction to Account Based Marketing
- description of ABM functions
- key subfunctions that differentiate ABM vendors
- vendor summary chart that shows who does what
- explanations of information provided in the report
- vendor profiles including a summary description, list of key features, and detailed information covering 37 categories including data sources, data storage, data outputs, target selection, planning, execution, analytics, operations, pricing, and vendor background.
Tuesday, February 02, 2016
Claritix Assembles Marketing Data for Analysis: Maybe That's Enough
Most of the work in any marketing analytics project is integrating data from multiple systems. Claritix carries this insight to one logical conclusion by offering a system that does data assembly, basic reporting, and little else. No fancy attribution methodologies or custom journey maps here (although they’re on the way). I’m not fully convinced this is enough to justify using Claritix but am open to the possibility. Here’s a deeper look.
As I just said, Claritix’s chief function is assembling customer data from multiple sources. The system has prebuilt connectors to import data from popular vendors including Salesforce.com, Marketo, Hubspot, SAP, SugarCRM, and Facebook. It can connect with others through standard APIs. The imported data is loaded into MongoDB, a NoSQL database that offers great flexibility and ease of deployment. Claritix applies sophisticated algorithms to cleans the data and match contacts based on similarity. It also uses matches created elsewhere such as lead IDs used to synchronize CRM and marketing automation data or cookie IDs imported from Google Analytics. The matching happens at both the contact and account level. Imported data includes contacts, funnel stages, campaigns, channels, revenue, and content.

Users can access this data through dashboards, charts, and views. There are different dashboards for the main data types (campaigns, funnel stages, channels, etc.). These provide basic information such as impressions, engagements, visits, deals and revenue by campaign, or sources, stages, conversion rates, and average duration by funnel stage. The specific measures depend on the data type. Users can drill into details down to the contact level. Views can show results for user-defined segments.
Claritix also lets users assemble information into binders, which are contain pages that are snapshots of dashboards, charts, and notes. These can be exported to PDF or slides or viewed directly within Claritix. Binders can update themselves at regular intervals. Collaboration features let users attach virtual “sticky notes” to screen images and share these via Slack or Claritix’s own communication channels.
So far as I know, that’s pretty much all that the system does. There is no capability, for example, to write the assembled data back to source systems for their own use. Claritix tells me this has been quite sufficient for their initial clients, who have liked the fact that set-up is virtually all automated or handled by the vendor. This has let them assemble data across multiple systems in ways that would otherwise have been impossible or hugely expensive. Certainly price is an advantage: Claritix starts at $1,000 per month for up to 10,000 contacts in the database, with the cost per contact decreasing for higher volumes. A system with more advanced reporting, such as Brightfunnel (which I reviewed in December and has been a consulting client) starts at $3,000 per month or higher. Still, you have to decide whether you’ll need the features that Claritix is missing; if so, you’ll end up missing many of the beneifts that good marketing measurement provides. As Captain Planet used to say, the power is yours.

As I just said, Claritix’s chief function is assembling customer data from multiple sources. The system has prebuilt connectors to import data from popular vendors including Salesforce.com, Marketo, Hubspot, SAP, SugarCRM, and Facebook. It can connect with others through standard APIs. The imported data is loaded into MongoDB, a NoSQL database that offers great flexibility and ease of deployment. Claritix applies sophisticated algorithms to cleans the data and match contacts based on similarity. It also uses matches created elsewhere such as lead IDs used to synchronize CRM and marketing automation data or cookie IDs imported from Google Analytics. The matching happens at both the contact and account level. Imported data includes contacts, funnel stages, campaigns, channels, revenue, and content.

Users can access this data through dashboards, charts, and views. There are different dashboards for the main data types (campaigns, funnel stages, channels, etc.). These provide basic information such as impressions, engagements, visits, deals and revenue by campaign, or sources, stages, conversion rates, and average duration by funnel stage. The specific measures depend on the data type. Users can drill into details down to the contact level. Views can show results for user-defined segments.
Claritix also lets users assemble information into binders, which are contain pages that are snapshots of dashboards, charts, and notes. These can be exported to PDF or slides or viewed directly within Claritix. Binders can update themselves at regular intervals. Collaboration features let users attach virtual “sticky notes” to screen images and share these via Slack or Claritix’s own communication channels.
So far as I know, that’s pretty much all that the system does. There is no capability, for example, to write the assembled data back to source systems for their own use. Claritix tells me this has been quite sufficient for their initial clients, who have liked the fact that set-up is virtually all automated or handled by the vendor. This has let them assemble data across multiple systems in ways that would otherwise have been impossible or hugely expensive. Certainly price is an advantage: Claritix starts at $1,000 per month for up to 10,000 contacts in the database, with the cost per contact decreasing for higher volumes. A system with more advanced reporting, such as Brightfunnel (which I reviewed in December and has been a consulting client) starts at $3,000 per month or higher. Still, you have to decide whether you’ll need the features that Claritix is missing; if so, you’ll end up missing many of the beneifts that good marketing measurement provides. As Captain Planet used to say, the power is yours.

Friday, July 18, 2014
Are Millennial Marketers More Analytical?
I had an interesting conversation this week with a vendor of marketing measurement systems on the question of why more marketers won’t buy his type of software. After all, surveys often show that marketers and CEOs alike rate better measurement as a high priority. Yet actual measurement techniques don’t improve much from year to year: to cite the most recent report to cross my desk, the 2014 State of Marketing Measurement Survey Report from Ifbyphone found that 45% of marketers are measuring Return on Investment in 2014 vs. 40% in 2013 -- a gain that is probably within the survey's margin of error. Other, simpler measures are more common and growing more quickly, but that’s exactly the point: marketers don’t invest in meaningful performance measures like ROI.

My vendor friend’s suspicion was that marketers don’t buy better measurement because, whatever they say in surveys, they really don’t want to be measured. My own opinion, based on comments from marketers over the years, is they don’t have time to put advanced measurement systems in place.
Of course, time is a matter of prioritization, so this really means that marketers think the time spent on an advanced measurement project will produce less value than if that time were spent on something else. In other words, marketers don’t invest in advanced measurement because they don’t think the resulting information will drive enough improvement in their marketing results. That's not an unreasonable belief: much ROI information is in fact interesting but not actionable and, therefore, adds no business value. Further evidence: the advanced measurement techniques that have been widely adopted, like marketing mix models and multi-touch attribution, all have proven bottom-line impact. The impact of marketing ROI, on the other hand, is often less clear.
Then our conversation took an unexpected turn: the vendor speculated that younger marketers might be more analytical and hence more inclined to ROI measurement. This was a new thought to me and offered the cheery prospect of an actual change from the long-term status quo. But neither of us had seen any research on the topic, so we couldn’t judge whether it was likely to be true. End of discussion.
I’ve since had time to look into this more deeply. There’s plenty of research on millennials’ (currently 19-34 years old) in general and a fair amount on their behavior in the workplace. Most of it reinforces familiar stereotypes: millenials are collaborative, tech-savvy, results-focused, fast-working, multi-tasking, anti-hierarchical, socially-conscious, company-disloyal, and of course digitally connected. But none of the research shed much light on whether they’re more or less analytical than older generations: since they’re skeptical of authority, you can expect them to be more open to challenging past assumptions, but this doesn’t necessarily mean they rely on data to resolve those challenges. They could just as easily rely on what feels right to them, even though they’ve had little time to sharpen their intuitions on the stone of reality. Even their presumed affinity for digital media, which is certainly more measurable than traditional media, doesn’t necessarily translate to an interest in ROI measurement. Indeed, most digital measurements such as Web traffic and social media interactions have almost nothing to do with ROI. Finding that millennials rely heavy on them would bode poorly for advanced measurement methods.
But all of this is just speculation, and I am definitely a fact-based kinda guy. Has anyone seen any information on how marketers’ behaviors differ by generation? If not, would you find it an interesting topic for a survey?
My vendor friend’s suspicion was that marketers don’t buy better measurement because, whatever they say in surveys, they really don’t want to be measured. My own opinion, based on comments from marketers over the years, is they don’t have time to put advanced measurement systems in place.
Of course, time is a matter of prioritization, so this really means that marketers think the time spent on an advanced measurement project will produce less value than if that time were spent on something else. In other words, marketers don’t invest in advanced measurement because they don’t think the resulting information will drive enough improvement in their marketing results. That's not an unreasonable belief: much ROI information is in fact interesting but not actionable and, therefore, adds no business value. Further evidence: the advanced measurement techniques that have been widely adopted, like marketing mix models and multi-touch attribution, all have proven bottom-line impact. The impact of marketing ROI, on the other hand, is often less clear.
Then our conversation took an unexpected turn: the vendor speculated that younger marketers might be more analytical and hence more inclined to ROI measurement. This was a new thought to me and offered the cheery prospect of an actual change from the long-term status quo. But neither of us had seen any research on the topic, so we couldn’t judge whether it was likely to be true. End of discussion.
I’ve since had time to look into this more deeply. There’s plenty of research on millennials’ (currently 19-34 years old) in general and a fair amount on their behavior in the workplace. Most of it reinforces familiar stereotypes: millenials are collaborative, tech-savvy, results-focused, fast-working, multi-tasking, anti-hierarchical, socially-conscious, company-disloyal, and of course digitally connected. But none of the research shed much light on whether they’re more or less analytical than older generations: since they’re skeptical of authority, you can expect them to be more open to challenging past assumptions, but this doesn’t necessarily mean they rely on data to resolve those challenges. They could just as easily rely on what feels right to them, even though they’ve had little time to sharpen their intuitions on the stone of reality. Even their presumed affinity for digital media, which is certainly more measurable than traditional media, doesn’t necessarily translate to an interest in ROI measurement. Indeed, most digital measurements such as Web traffic and social media interactions have almost nothing to do with ROI. Finding that millennials rely heavy on them would bode poorly for advanced measurement methods.
But all of this is just speculation, and I am definitely a fact-based kinda guy. Has anyone seen any information on how marketers’ behaviors differ by generation? If not, would you find it an interesting topic for a survey?
Thursday, April 11, 2013
Adometry Combines Attribution with Optimization
So…my last two posts on attribution systems (MMA and VisualIQ ) were among the least popular ever, right down there with Marketing Lessons from Chernobyl (which, let’s face it, was in pretty poor taste). But vox populi isn’t always vox Dei, eh? I think it’s an important topic, so here we go again.
The lucky recipient of that less-than-stirring introduction is Adometry, which in no way deserves any disrespect. From humble beginnings in click fraud prevention, they have grown in recent years to be one of the leaders in algorithmic response attribution. Their latest expansion moves them beyond digital channels to offline media including direct mail, television, and print. They have also moved from attributing past results to using predictive models to optimize current and future campaigns. Impressive.
The core of Adometry’s attribution methodology is to compile the sequence of marketing messages seen by each individual, and then compare results of individuals whose sequence differs by only one message. Any difference in results is then attributed to that message. This is conceptually simple, but requires clever treatments to handle low volumes for specific sequences and to isolate the impact of attributes such as placement, time slot, creative, and list segment. Adometry also lets users model against multiple events in the customer life cycle, such as sign-ups, first purchase, and repeat purchase. It calls these all conversions, which I personally found a bit confusing but suppose would quickly get used to.
The system also classifies each conversion as attributable, multi-touch, and multi-channel, depending on whether it was linked to at least one message (attributable), to multiple messages (multi-touch) and to messages in multiple channels (multi-channel). For each category, it shows the conversion count and revenue: so, for example, you see the number and revenue for multi-touch repeat purchases. That’s a lot of information to digest, but does give a great deal of insight into the effect of different promotions and channels on different parts of the business. This encourages marketers to look beyond any single measure, such as cost per order, that tells only a small part of the business story.

The system’s optimization process begins with the attribution analysis, but then adds auto-generated predictive models to estimate the impact of future ad plans, including interactions across channels. Users can enter scenarios with budgets for multiple channels and campaigns, and then apply other constraints such as limits on the change in spending per channel. They also define output measures for the system to optimize against: like other optimization systems, Adometry can only optimize against a single measure, but this can be a composite of several items. For each scenario, the system will determine the optimal budget allocation and show the expected results across each output measure. Users can modify the recommended plan and have the system re-forecast the results. The final plan can be output to a spreadsheet for further editing. Adometry can also be connected directly to ad buying platforms, including systems for real time bidding on individual impressions. The company says optimization typically yields a 20% to 40% improvement in ad-to-sales ratios.
The database of marketing messages per individual can be used for other types of analysis. These include reach and frequency reports, which show the number of individuals reached in total, reached in each channel, and reached exclusively for each channel. The reports count impressions as well as individuals; show how many people were reached in each combination of channels; show the number of people with each number of impressions (one, two, three, etc.); and show the current member count in each funnel stage.
Adometry’s data comes primarily from tags embedded in advertisements, emails, and other online messages, which drop cookies to identify who sees which message. The system can also draw data from Web server logs or third party tags. Adometry can further enrich its database by appending external information about individuals, using both online and offline sources. This lets it profile the audiences associated with different events, channels, campaigns, and other attributes. Optimization models can use data that can’t be tied to specific individuals, such as weather, economic conditions, and mass media like television and print. The system can also verify which ads were actually seen by individuals, providing more precise inputs to the attribution calculations.
Pricing for Adometry is based on the number of channels and volume of data. It starts around $100,000 per year for the smallest clients with enough volume to use the system effectively (about 30 to 50 million impressions per month). Currently, more than 50 companies use Adometry’s attribution services.
The lucky recipient of that less-than-stirring introduction is Adometry, which in no way deserves any disrespect. From humble beginnings in click fraud prevention, they have grown in recent years to be one of the leaders in algorithmic response attribution. Their latest expansion moves them beyond digital channels to offline media including direct mail, television, and print. They have also moved from attributing past results to using predictive models to optimize current and future campaigns. Impressive.
The core of Adometry’s attribution methodology is to compile the sequence of marketing messages seen by each individual, and then compare results of individuals whose sequence differs by only one message. Any difference in results is then attributed to that message. This is conceptually simple, but requires clever treatments to handle low volumes for specific sequences and to isolate the impact of attributes such as placement, time slot, creative, and list segment. Adometry also lets users model against multiple events in the customer life cycle, such as sign-ups, first purchase, and repeat purchase. It calls these all conversions, which I personally found a bit confusing but suppose would quickly get used to.
The system also classifies each conversion as attributable, multi-touch, and multi-channel, depending on whether it was linked to at least one message (attributable), to multiple messages (multi-touch) and to messages in multiple channels (multi-channel). For each category, it shows the conversion count and revenue: so, for example, you see the number and revenue for multi-touch repeat purchases. That’s a lot of information to digest, but does give a great deal of insight into the effect of different promotions and channels on different parts of the business. This encourages marketers to look beyond any single measure, such as cost per order, that tells only a small part of the business story.

The system’s optimization process begins with the attribution analysis, but then adds auto-generated predictive models to estimate the impact of future ad plans, including interactions across channels. Users can enter scenarios with budgets for multiple channels and campaigns, and then apply other constraints such as limits on the change in spending per channel. They also define output measures for the system to optimize against: like other optimization systems, Adometry can only optimize against a single measure, but this can be a composite of several items. For each scenario, the system will determine the optimal budget allocation and show the expected results across each output measure. Users can modify the recommended plan and have the system re-forecast the results. The final plan can be output to a spreadsheet for further editing. Adometry can also be connected directly to ad buying platforms, including systems for real time bidding on individual impressions. The company says optimization typically yields a 20% to 40% improvement in ad-to-sales ratios.
The database of marketing messages per individual can be used for other types of analysis. These include reach and frequency reports, which show the number of individuals reached in total, reached in each channel, and reached exclusively for each channel. The reports count impressions as well as individuals; show how many people were reached in each combination of channels; show the number of people with each number of impressions (one, two, three, etc.); and show the current member count in each funnel stage.
Adometry’s data comes primarily from tags embedded in advertisements, emails, and other online messages, which drop cookies to identify who sees which message. The system can also draw data from Web server logs or third party tags. Adometry can further enrich its database by appending external information about individuals, using both online and offline sources. This lets it profile the audiences associated with different events, channels, campaigns, and other attributes. Optimization models can use data that can’t be tied to specific individuals, such as weather, economic conditions, and mass media like television and print. The system can also verify which ads were actually seen by individuals, providing more precise inputs to the attribution calculations.
Pricing for Adometry is based on the number of channels and volume of data. It starts around $100,000 per year for the smallest clients with enough volume to use the system effectively (about 30 to 50 million impressions per month). Currently, more than 50 companies use Adometry’s attribution services.
Wednesday, May 23, 2012
6 Key Marketing Measures That Don't Include Revenue
Ask most marketers how they measure performance, and they’ll tell you they look at results: incremental revenue or return on investment if they’re available, or response rates if they're not. Industry experts take a similar approach, focusing largely on the need for better revenue measures. The situation – and barely concealed frustration – is captured perfectly in the headline from a recent Forrester Consulting study sponsored by Silverpop: “Response Metrics Are Used To Evaluate Success, Leaving Customer Or Business Impact Metrics Largely Ignored”.

I agree that revenue is important, but humbly suggest that there’s more to marketing measurement than ROI. Marketers need several types of information – and shouldn’t let the quest for performance measures prevent them from meeting other requirements.
Here are six non-value measures that marketers should build into their reporting systems.
The types of measures I’ve just described don’t replace revenue and ROI reporting. Rather, they meet needs that revenue reports alone cannot. Ideally, all these types of information will be combined in a marketing dashboard that provides a quick overview of critical information and allows drilling into details when necessary. Marketers should realize that the contents of this dashboard will change over time as their focus shifts to different programs and strategic goals. They should also recognize that good reporting will generate new questions as it uncovers risks and opportunities that would otherwise have gone undetected. The system should make those questions easier to answer, but marketers shouldn't expect their total work to decrease. What they can expect is that better reporting will increase the value created by their efforts: yet another new metric, Return on Reporting, should go up.

I agree that revenue is important, but humbly suggest that there’s more to marketing measurement than ROI. Marketers need several types of information – and shouldn’t let the quest for performance measures prevent them from meeting other requirements.
Here are six non-value measures that marketers should build into their reporting systems.
- Benchmarks. Sure, marketing’s job is to generate revenue, but is generating $1 million good or bad? The only way to know is by placing the number in context, which could be this year’s marketing plan or last year’s actual results. Even if marketers can’t measure revenue, they can set benchmarks for metrics like number of leads generated, funnel conversion rates, or cost per order. In fact, measuring components that contribute to results gives better insights into marketing performance than reporting on the results themselves. For this reason, marketers who can’t directly measure marketing-generated revenue should think twice before creating complex indirect estimates that are hard to understand and have limited credibility. The money would probably be better spent on reports that provide a clearer picture of what’s actually happening.
- Projections. Past results are interesting but the future is more important. Again, the real need is to understand the factors that determine future results, such as response rates and funnel velocity. Changes in these can give early warning of risks and opportunities. The trick is to distinguish real trends from random variations, so marketers react quickly without chasing too many false alarms.
- Operations. It’s easy to make mistakes in setting up a marketing program, especially one with multiple stages, lead scoring models, and decision rules. Even careful testing can’t always capture all program steps or contingencies. Marketers need reports on the number of people in each program stage and receiving each message, and they need a model that lets them know whether those numbers are reasonable. Reports should show both program-to-date and weekly or daily results: cumulative data show major errors such as bad program logic, and short-term results capture small problems, such as a missed processing step, that could get lost in a program-to-date aggregate.
- Exceptions. Projections and benchmarks put data in context, but marketers don't have time to comb through every figure. They need exception reports to highlight the most important variations, both positive and negative. Marketers also need tools to drill into the exceptions so they can understand what happened and identify new opportunities.
- Testing. Formal tests are the most certain way to understand the impact of marketing projects, but they often require special reporting tools such as ways to compare results for different customer groups over time. Incremental revenue is the ultimate measure for test evaluation, but often other metrics such as response rates or velocity are easier to capture and more directly relevant. Reaping the full benefit of tests also requires systems to distribute results and catalog findings for future reference.
- Strategic Goals. Marketing plans should be based on corporate strategy, but long-term goals fade into the background once marketers start making tactical choices based on day-to-day results. The reporting system should provide direct measures of strategic objectives – things like penetration of new market segments and exploration of new channels – so marketers can see the cumulative impact of deviations from the original plans. Many strategic goals, such as process change, staff training, and systems deployment, are not measured in revenue at all.
The types of measures I’ve just described don’t replace revenue and ROI reporting. Rather, they meet needs that revenue reports alone cannot. Ideally, all these types of information will be combined in a marketing dashboard that provides a quick overview of critical information and allows drilling into details when necessary. Marketers should realize that the contents of this dashboard will change over time as their focus shifts to different programs and strategic goals. They should also recognize that good reporting will generate new questions as it uncovers risks and opportunities that would otherwise have gone undetected. The system should make those questions easier to answer, but marketers shouldn't expect their total work to decrease. What they can expect is that better reporting will increase the value created by their efforts: yet another new metric, Return on Reporting, should go up.
Monday, June 20, 2011
How Do You Measure the Influence of Marketing Messages?
My review of Coremetrics Lifestyle raised the issue of measuring the impact of marketing materials on customer behavior. Of course, this is just one piece of the marketing attribution puzzle. But it’s worth a separate discussion because it’s such a common question – and, unlike so many measurement problems, this one actually has an answer.
Let’s start with the original impetus. This was an “influence” report that showed the percentage of people reaching a marketing stage who had received specific marketing treatments (or had other attributes such as source, product history, demographic, etc.). The idea was that treatments received by a higher percentage of customers were more influential. In other words, if 100% of new buyers saw a white paper offer and just 50% saw a Webinar invitation, then the white paper has more influence than the Webinar.
Plausible, yes. But wrong.
Let’s think through the example. What if the white paper is offered to everyone? Yes, 100% of new buyers saw it, but so did 100% of non-buyers. We know exactly nothing about whether it made its recipients more or less likely to purchase.
Now, let’s say just 10% of prospects see the Webinar invitation, compared with 50% of buyers. Can we say it has a positive influence? Still no: maybe the Webinar attracts hot prospects who would have purchased anyway. It’s even possible that the Webinar offer annoys people and actually reduces purchase rates. You can’t tell from these figures.
In other words, it’s not enough to know what was seen by customers who became buyers (or, more generally, by people who took any particular action). You also need to know what was seen by non-buyers and, ideally, to compare results for groups that are similar except for that particular treatment.
So, what measures do make sense for assessing influence?
- the simplest measure compares the result rate of treated customers with results for non-treated customers. You might find that 20% of people who receive a white paper became buyers, compared with 10% of people who don’t receive the white paper. These two figures can be combined in a single ratio: 20% of treated / 10% of non-treated = 2.0. The higher the ratio, the more it seems that receiving the white paper increased the likelihood that someone would purchase. But it’s no more than a suggestion: maybe the white paper was sent to people who were stronger prospects to begin with.
- a more advanced measure adjusts for the audience by attempting to limit the non-treated group (e.g., non-buyers) to customers similar to the target group. This could be done by building a statistical model that uses all other attributes to predict behavior. Or, you could apply lead scores or funnel stage definitions. Whatever the technique, the result is to divide the audience into groups that are expected to behave similarly. The calculation would then compare results of treated vs. non-treated customers in each same group. So, a report might find that 40% of “stage 3 leads” (whatever they are) made a purchase after attending a Webinar, while just 15% of “stage 3 leads” made a purchase if they didn't attend a Webinar. Again, the treated and non-treated figures could be combined in a ratio (40% / 15% = 2.7)
- of course, the only true measure is a structured test. This ensures that the only difference between the treated and non-treated groups is the treatment itself. Without such tests, there's a good chance that the customers selected for treatment would have performed differently in any event.
A proper reporting system would present the ratios along with actual result rates, trends over time, the number of customers receiving each treatment, and comparisons with ratios for other treatments. These figures help marketers focus their energies on the most valuable opportunities. Still, the starting point is always a comparison of treated vs. non-treated performance: without that, the numbers could mean anything.
Let’s start with the original impetus. This was an “influence” report that showed the percentage of people reaching a marketing stage who had received specific marketing treatments (or had other attributes such as source, product history, demographic, etc.). The idea was that treatments received by a higher percentage of customers were more influential. In other words, if 100% of new buyers saw a white paper offer and just 50% saw a Webinar invitation, then the white paper has more influence than the Webinar.
Plausible, yes. But wrong.
Let’s think through the example. What if the white paper is offered to everyone? Yes, 100% of new buyers saw it, but so did 100% of non-buyers. We know exactly nothing about whether it made its recipients more or less likely to purchase.
Now, let’s say just 10% of prospects see the Webinar invitation, compared with 50% of buyers. Can we say it has a positive influence? Still no: maybe the Webinar attracts hot prospects who would have purchased anyway. It’s even possible that the Webinar offer annoys people and actually reduces purchase rates. You can’t tell from these figures.
In other words, it’s not enough to know what was seen by customers who became buyers (or, more generally, by people who took any particular action). You also need to know what was seen by non-buyers and, ideally, to compare results for groups that are similar except for that particular treatment.
So, what measures do make sense for assessing influence?
- the simplest measure compares the result rate of treated customers with results for non-treated customers. You might find that 20% of people who receive a white paper became buyers, compared with 10% of people who don’t receive the white paper. These two figures can be combined in a single ratio: 20% of treated / 10% of non-treated = 2.0. The higher the ratio, the more it seems that receiving the white paper increased the likelihood that someone would purchase. But it’s no more than a suggestion: maybe the white paper was sent to people who were stronger prospects to begin with.
- a more advanced measure adjusts for the audience by attempting to limit the non-treated group (e.g., non-buyers) to customers similar to the target group. This could be done by building a statistical model that uses all other attributes to predict behavior. Or, you could apply lead scores or funnel stage definitions. Whatever the technique, the result is to divide the audience into groups that are expected to behave similarly. The calculation would then compare results of treated vs. non-treated customers in each same group. So, a report might find that 40% of “stage 3 leads” (whatever they are) made a purchase after attending a Webinar, while just 15% of “stage 3 leads” made a purchase if they didn't attend a Webinar. Again, the treated and non-treated figures could be combined in a ratio (40% / 15% = 2.7)
- of course, the only true measure is a structured test. This ensures that the only difference between the treated and non-treated groups is the treatment itself. Without such tests, there's a good chance that the customers selected for treatment would have performed differently in any event.
A proper reporting system would present the ratios along with actual result rates, trends over time, the number of customers receiving each treatment, and comparisons with ratios for other treatments. These figures help marketers focus their energies on the most valuable opportunities. Still, the starting point is always a comparison of treated vs. non-treated performance: without that, the numbers could mean anything.
Thursday, November 04, 2010
Right On Interactive Offers Lifecycle Reporting
Summary: Right On Interactive has added great life stage reporting to the data integration and output generation features of its earlier 5Buckets product. It could supplement a traditional marketing automation system or perhaps replace one. Either way, it’s worth a look to see what you’re missing.
When I reviewed Right On Interactive in a July 2009 post, the company was selling its 5Buckets marketing software as a multi-channel output generation tool that complemented conventional marketing automation systems. Since then, Right On has expanded its functions, dropped the 5Buckets name, and repositioned itself as a marketing automation alternative focused on “customer lifecycle marketing”. It’s tempting to discuss the business strategy behind this, but I assume that you Dear Reader are a marketer and therefore it's not your problem So let’s look at what the system actually does.
We'll start with the standard marketing automation functions. These are what you need if Right On is really to substitute for one of the better-known products:
What that means in practice is users can assign contacts to lifecycle stages. This lets the system track contacts as they move through the buying, on-boarding and retention processes. Specifically, it generates reports on the number of contacts in each stage, stage-to-stage conversion rates, and average time spent in each stage. It stores each contact’s stage and score histories so it can report on trends in these metrics as well.
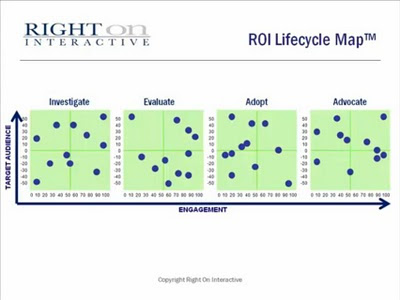
Digging a bit deeper: users define the stages by creating segmentation rules similar to standard queries. The system checks each contact against the rules, assigning the contact to the latest stage for which they qualify. The actual stages can be whatever the user wants. Right On's default set holds two lead stages (investigate and evaluate) and two customer stages (value and advocate).
But there's more. Right On creates scatter plots of contacts in each stage, using customer fit and activity scores as dimensions. The resulting “lifecycle map” is a graphic representation of the shape and quality of the company's contact inventories. The plots are interactive: users can select a group on the plot to create a new segment and can drill down to see the details of the individual contacts. They can view reports and maps for all contacts or selected segments.
Right On recognizes that its data could be used to project future business and to correlate stage changes with marketing campaigns, although it hasn’t yet built these features. Once it does, the system will go a long way to providing the stage-based marketing measurement that I’ve been arguing marketers really need. (You can also view my Marketo-sponsored Webinar on the topic.)
So where does this leave us?
I’m lukewarm about Right On as a primary marketing automation system but see great value in its lifecycle reporting. Pricing is relatively modest – starting at just under $1,700 per month for up to 50,000 contacts – so larger firms may be able to use both Right On and a conventional marketing automation product. Smaller companies will probably have to choose one or the other.
When I reviewed Right On Interactive in a July 2009 post, the company was selling its 5Buckets marketing software as a multi-channel output generation tool that complemented conventional marketing automation systems. Since then, Right On has expanded its functions, dropped the 5Buckets name, and repositioned itself as a marketing automation alternative focused on “customer lifecycle marketing”. It’s tempting to discuss the business strategy behind this, but I assume that you Dear Reader are a marketer and therefore it's not your problem So let’s look at what the system actually does.
We'll start with the standard marketing automation functions. These are what you need if Right On is really to substitute for one of the better-known products:
- data management: Right On can import files from any source, placing the data into standard structures or custom tables. Users can link the imported data to any other table, allowing complex data structures. They can also load data to the system API. This is more powerful than many marketing automation products, which are largely limited to a company, contact and activity history files.
- segmentation: users can define segments using a step-by-step query builder or by writing SQL. The query builder supports complex relationships. This is competitive with or better than standard marketing automation systems.
- campaign design: users can define campaigns with multiple “tactics” . Each tactic has its own action, schedule, metrics, documents, and start and end dates. Contacts can enter a tactic from an assigned segment or flow from a previous tactic based on their response and a user-specified waiting period. These features let Right On support multi-step campaigns although complex designs would be a challenge.
- create emails and forms: Right On uses ExactTarget for email and form creation. The integration is fairly smooth since the editing features are accessed within the Right On interface. A native solution is under development but the current approach should work for unless you have a particular aversion to ExactTarget.
- campaign actions: each tactic can execute one action. These include sending an email via Salesforce.com or ExactTarget, creating a Salesforce.com task, generating an output file, and sending emails to Foursquare friends. This covers the basic needs, although most other products also offer options such as changing data and adding a contact to a list or campaign.
- CRM integration: Right On can synchronize data with Salesforce.com and Microsoft CRM on a regular basis. It can also pull file segments and Salesforce.com campaign members as lists. This makes it roughly equivalent to other products. Right On also has a connector with location-based social network Foursquare.
- campaign reporting: users can manually enter campaign costs, target revenue, and actual revenue. The system will capture responses and use the results for response reporting, cost per response and return on investment. This is pretty standard stuff, although many other systems can also import opportunity revenue automatically from Salesforce.com – a feature still in Right On’s future.
- lead scoring: users can define separate scores for customer fit and activities. Customer fit is based on static attributes such as title while activity score is based on events such as email opens or Twitter posts. There’s also an engagement index that compares the actual activity score with the maximum possible score had the contact responded to every promotion. The scoring rules are built in the usual fashion, by assigning to points to different attribute values or different events, although the interface is nicer than most. Contacts are rescored nightly. The scores are stored on the customer record and can trigger an action to send the contact to Salesforce.com. This is on par with other products.
What that means in practice is users can assign contacts to lifecycle stages. This lets the system track contacts as they move through the buying, on-boarding and retention processes. Specifically, it generates reports on the number of contacts in each stage, stage-to-stage conversion rates, and average time spent in each stage. It stores each contact’s stage and score histories so it can report on trends in these metrics as well.
Digging a bit deeper: users define the stages by creating segmentation rules similar to standard queries. The system checks each contact against the rules, assigning the contact to the latest stage for which they qualify. The actual stages can be whatever the user wants. Right On's default set holds two lead stages (investigate and evaluate) and two customer stages (value and advocate).
But there's more. Right On creates scatter plots of contacts in each stage, using customer fit and activity scores as dimensions. The resulting “lifecycle map” is a graphic representation of the shape and quality of the company's contact inventories. The plots are interactive: users can select a group on the plot to create a new segment and can drill down to see the details of the individual contacts. They can view reports and maps for all contacts or selected segments.

Right On recognizes that its data could be used to project future business and to correlate stage changes with marketing campaigns, although it hasn’t yet built these features. Once it does, the system will go a long way to providing the stage-based marketing measurement that I’ve been arguing marketers really need. (You can also view my Marketo-sponsored Webinar on the topic.)
So where does this leave us?
I’m lukewarm about Right On as a primary marketing automation system but see great value in its lifecycle reporting. Pricing is relatively modest – starting at just under $1,700 per month for up to 50,000 contacts – so larger firms may be able to use both Right On and a conventional marketing automation product. Smaller companies will probably have to choose one or the other.
Thursday, May 20, 2010
Omniture Study Suggests Marketers Doubt Value of Analytics Investment
Not to beat a dead horse, but Wednesday’s eMarketer reported on yet another survey that touched on the question of why marketers don’t measure. Although the Omniture 2010 Online Analytics Survey is obviously limited to Web analytics, the answers probably apply to other types of measurement as well.
I wasn’t able to get a copy of the full survey results, despite two requests to Omniture and even filling it out myself, which was supposed to yield a copy that compared my answers with my peers'. Perhaps I’m peerless. But the snippets published in eMarketer are enough for now.

Specifically, eMarketer reported that the leading challenge in Web analytics was “talent”, cited by 58.4% of respondents. Assuming that “talent” is really a polite way of saying “skilled staff”, this suggests that lack of education, not lack of time, is the critical roadblock to better measurement. I’ve been betting the reason is time, but would reconsider in the face of new evidence.
But wait.
When I took the survey, the question about “talent” actually defined it as "lack of skill/time". So it’s perfectly possible that marketers picking "talent" really saw lack of time as the most important challenge.
My position is arguably strengthened by the relatively low ranking of "support/training" (37.6%) and "budget" (31.7%) in the answers. Those can certainly improve skills but they can’t expand the manager's available time. Even hiring more staff wouldn't do that.
On the other hand, the second- and third-ranked challenges were "actionability" (47.3%) and "finding insights" (41.5%) which both suggest doubts that Web analytics can deliver real value. This would show a need for education – but, as I wrote in my comment on the original Why Marketers Don't Measure post, it's a need for education in the fundamental utility of measurement, not education in specific techniques.
Bottom line: the Omniture survey confirms that marketers won’t invest in analytics until they’re convinced it’s the best use of their limited resources. Efforts to expand adoption of analytics should start with that.
I wasn’t able to get a copy of the full survey results, despite two requests to Omniture and even filling it out myself, which was supposed to yield a copy that compared my answers with my peers'. Perhaps I’m peerless. But the snippets published in eMarketer are enough for now.

Specifically, eMarketer reported that the leading challenge in Web analytics was “talent”, cited by 58.4% of respondents. Assuming that “talent” is really a polite way of saying “skilled staff”, this suggests that lack of education, not lack of time, is the critical roadblock to better measurement. I’ve been betting the reason is time, but would reconsider in the face of new evidence.
But wait.
When I took the survey, the question about “talent” actually defined it as "lack of skill/time". So it’s perfectly possible that marketers picking "talent" really saw lack of time as the most important challenge.
My position is arguably strengthened by the relatively low ranking of "support/training" (37.6%) and "budget" (31.7%) in the answers. Those can certainly improve skills but they can’t expand the manager's available time. Even hiring more staff wouldn't do that.
On the other hand, the second- and third-ranked challenges were "actionability" (47.3%) and "finding insights" (41.5%) which both suggest doubts that Web analytics can deliver real value. This would show a need for education – but, as I wrote in my comment on the original Why Marketers Don't Measure post, it's a need for education in the fundamental utility of measurement, not education in specific techniques.
Bottom line: the Omniture survey confirms that marketers won’t invest in analytics until they’re convinced it’s the best use of their limited resources. Efforts to expand adoption of analytics should start with that.
Monday, April 05, 2010
VisualIQ Measures Marketing Impacts Across All Channels
Summary: VisualIQ combines customer-level transactions and contact history with traditional aggregate data to produce better marketing performance measurement. It hasn't solved the problem of identifying the same customer across channels, but it's trying.
I was going to start this post by writing that last-click attribution has recently come under fire, but the first Google hit on the topic brings up a study from 2007. So maybe the criticism isn’t particularly new. But the fact remains that, now more than ever, marketers are trying to measure the impact of all contacts on customer behavior.
Broadly speaking, the problem is attacked in two ways. One, most common among consumer goods manufacturers and others who do not sell directly to their customers, uses aggregated data in marketing mix models to find correlations between marketing efforts and total sales. The other, favored by banks, retailers, communications providers and others who do sell directly to known buyers, assesses the impact of each contact with specific individuals. Last-click attribution is a particular challenge for online marketers because they fall between these two situations: they can often identify their buyers but not trace their full contact history.
VisualIQ, founded in 2005 as Connexion.a, proposes to straddle these worlds by combining aggregate-level models with customer-specific contact history. They haven’t found a magic bullet: like everyone else, VisualIQ tracks online customers through cookies, with all the limits that implies. But VisualIQ strives to make the best use of what’s available by unifying data from as many online campaigns as possible, linking cookies with online transactions, and then linking online transactions to offline identities.
This approach offers some general advantages and two specific capabilities. The general advantages come from assembling all advertising and customer transaction information in one database. This allows VisualIQ to analyze campaign results, do whatever identity matching is possible, and to isolate the impact of source, contact frequency, demographics, location and other variables. VisualIQ, a hosted service, has invested heavily in technology to analyze massive data sets along such dimensions.
The first specific capability is relating pre-purchase contacts to actual purchases for individual customers, thus moving beyond last-click attribution. Although this is subject to the limits of cookie-based tracking, VisualIQ does what it can to build a unified identity by sharing the same cookie IDs across as many online channels as possible. The second capability is building mix models with data from actual customer contacts instead of market-level estimates or surveys. VisualIQ says it has found this yields more accurate results than traditional information.
This is all good stuff and VisualIQ has packaged it nicely in a tiered set of offerings. These range from campaign-level reporting to customer-based insights to predictive modeling and simulation, with prices for the simplest system starting as low as $5,000 to $10,000 per month. The company has had considerable success, counting major banks, retailers, and communications firms as clients. Note that these are all industries that sell to their customers directly.
But VisualIQ’s specific offerings are just part of the story. What’s really important is setting explicit goals of linking identities across channels and measuring cross-channel marketing impacts. These are arguably the core challenges in marketing measurement today. This focus has led VisualIQ to look for alternatives to cookies and to use existing methods to combine online and offline information for the same person.
The company is also seeking to make it easier to apply its results. Today, it basically generates reports that suggest better media allocations and advertising contents. But it is working to automatically feed those findings as rules into execution systems such as ad servers and ad exchanges. This brings marketers closer to the ultimate goal of self-optimizing programs. Other vendors are also pursuing self-optimization, but VisualIQ promises the advantage of decisions based on data from all channels rather than a single channel or, heaven forbid, just the last click.
I was going to start this post by writing that last-click attribution has recently come under fire, but the first Google hit on the topic brings up a study from 2007. So maybe the criticism isn’t particularly new. But the fact remains that, now more than ever, marketers are trying to measure the impact of all contacts on customer behavior.
Broadly speaking, the problem is attacked in two ways. One, most common among consumer goods manufacturers and others who do not sell directly to their customers, uses aggregated data in marketing mix models to find correlations between marketing efforts and total sales. The other, favored by banks, retailers, communications providers and others who do sell directly to known buyers, assesses the impact of each contact with specific individuals. Last-click attribution is a particular challenge for online marketers because they fall between these two situations: they can often identify their buyers but not trace their full contact history.
VisualIQ, founded in 2005 as Connexion.a, proposes to straddle these worlds by combining aggregate-level models with customer-specific contact history. They haven’t found a magic bullet: like everyone else, VisualIQ tracks online customers through cookies, with all the limits that implies. But VisualIQ strives to make the best use of what’s available by unifying data from as many online campaigns as possible, linking cookies with online transactions, and then linking online transactions to offline identities.
This approach offers some general advantages and two specific capabilities. The general advantages come from assembling all advertising and customer transaction information in one database. This allows VisualIQ to analyze campaign results, do whatever identity matching is possible, and to isolate the impact of source, contact frequency, demographics, location and other variables. VisualIQ, a hosted service, has invested heavily in technology to analyze massive data sets along such dimensions.
The first specific capability is relating pre-purchase contacts to actual purchases for individual customers, thus moving beyond last-click attribution. Although this is subject to the limits of cookie-based tracking, VisualIQ does what it can to build a unified identity by sharing the same cookie IDs across as many online channels as possible. The second capability is building mix models with data from actual customer contacts instead of market-level estimates or surveys. VisualIQ says it has found this yields more accurate results than traditional information.
This is all good stuff and VisualIQ has packaged it nicely in a tiered set of offerings. These range from campaign-level reporting to customer-based insights to predictive modeling and simulation, with prices for the simplest system starting as low as $5,000 to $10,000 per month. The company has had considerable success, counting major banks, retailers, and communications firms as clients. Note that these are all industries that sell to their customers directly.
But VisualIQ’s specific offerings are just part of the story. What’s really important is setting explicit goals of linking identities across channels and measuring cross-channel marketing impacts. These are arguably the core challenges in marketing measurement today. This focus has led VisualIQ to look for alternatives to cookies and to use existing methods to combine online and offline information for the same person.
The company is also seeking to make it easier to apply its results. Today, it basically generates reports that suggest better media allocations and advertising contents. But it is working to automatically feed those findings as rules into execution systems such as ad servers and ad exchanges. This brings marketers closer to the ultimate goal of self-optimizing programs. Other vendors are also pursuing self-optimization, but VisualIQ promises the advantage of decisions based on data from all channels rather than a single channel or, heaven forbid, just the last click.
Monday, October 12, 2009
5 Steps to Marketing Measurement Maturity
Summary: marketing performance measurement can start with simple response tracking, and grow in stages to show business impact, track the buying process, optimize results and demonstrate strategic alignment. Each stage adds new data, systems, measures and processes.
I’ll be talking about marketing measurement this Tuesday at Silverpop’s B2B Marketing University seminar in Palo Alto, with a repeat performance in Boston on November 4. The core of my presentation will be a 5-step measurement maturity model for B2B marketers. This post will give you a brief summary.
A little background: marketers’ objectives for performance measurement generally fall into five broad categories: measure response, show business impact, track the buying process, optimize results and demonstrate marketing alignment with business strategy. Each category has different requirements for data, systems, measures, and processes. Because some of these requirements overlap, there’s a natural progression starting with the simplest requirements and adding new requirements for each stage. This progression leads to a maturity model. Here are the details.
1. Measure Response. The most basic requirement is simply to count the number of responses to each marketing program. This stage also includes the closely related step of calculating the cost of those responses for a simple cost-per-response measure that can be used for a rough ranking of investments.
Key data needs for this stage include mechanisms to capture responses and campaign costs and to link responses to campaigns. This requires a campaign management system to execute the campaigns and track their costs, and a marketing database that stores the identity, promotion history and response history of leads generated by the campaigns.
2. Show Business Impact of Marketing Campaigns. The cost per response tells little about the business impact of a marketing program. You must also know the value of those responses. At a minimum, this requires linking marketing leads to closed sales. This typically means importing closed opportunity records from a sales automation system and linking those opportunities back to the original marketing lead. Add the cost data already gathered in stage 1 (response measurement) and you can calculate a simple Return on Investment based on revenue / acquisition cost.
Of course, true ROI is based on profits, not revenue, and incorporates all incremental costs, not just the initial marketing expense. A proper business impact measurement thus requires capturing the full marketing, sales and product costs associated with new leads, as well as their actual or estimated long-term value. These give a ROI measure that comes reasonably close to showing the true business impact of each acquisition campaign.
In terms of new requirements, this step adds sales opportunity data, which implies integration with a sales force automation or CRM system. It also requires processes to assign opportunities to leads and leads to campaigns, and, optionally, ways to import and connect lifetime costs and revenues.
Keep in mind that this approach only applies to lead acquisition campaigns, not to campaigns that nurture existing leads or customers, or branding campaigns that don’t generate a direct response. This is a smaller issue for B2B marketers than many consumer marketers, who often have no direct way to identify the customers acquired or influenced by their activities.
3. Understand the Buying Process. This stage looks at the impact of non-acquisition marketing treatments on moving customers through the buying process. It requires defining stages within the buying process, tracking the movement of individual leads through those stages over time, recording the marketing treatments applied to those individuals, and measuring the correlation (if any) of treatments to stage changes. The result is both a more detailed understanding of the buying process and a way to decide which treatments are most valuable.
Meeting these requirements implies capturing more information about leads, including static attributes (company, job title, etc.) and behaviors such as Web site visits and email responses. These can be used in scoring models or other tools that decide which stage a lead is in at any given moment. The system must also keep a history of each lead’s stages over time, so it can correlate stage changes with treatments. The treatments themselves are already captured in the marketing database needed for response measurement, so they do not represent a new requirement.
4. Optimize Results. Once you’re tracking lead movement through process stages and measuring the impact of individual treatments, you’re ready to build an end-to-end model that calculates the impact of each small change on final sales. You can then optimize the combination of treatments across the process. For example, you might find you can spend less on acquiring new leads if you spend more on nurturing existing ones, to produce the same sales volume at lower cost.
The calculations for this type of optimization are fairly simple, and they don’t require any new information beyond the previous stage in the maturity model. But you do need more precise information about the impact of different treatments, which means formal testing of alternative treatments and careful analysis of results. You’ll also need a business simulation model that can estimate the impact of changes on near-term revenues and costs, since the company still has its quarterly targets to hit. You'll also need to define you goals -- higher revenue? higher profit rate? lower marketing costs? -- so you know what to optimize.
Ideally, you’ll also add optimization software that can automatically find the best of all possible treatment combinations. But few B2B marketers have the data volume or statistical skills required for this, so you’ll probably end up manually running a variety of scenarios through your simulation model instead.
5. Demonstrate Strategic Alignment. Delivering the optimal set of treatments won’t satisfy your CEO if your marketing programs don’t align with the larger business strategy. That alignment may in fact require campaigns that produce low short-term returns, such as investing in a new product or market segment.
To demonstrate alignment, you must first show that your planned marketing activities support business goals, and then show that those activities have yielded the expected results. For example, a strategy based on selling to a new group of customers might yield a marketing plan with 10% of acquisition spending aimed at generating leads from that segment, and a goal of that segment accounting for 5% of new leads received.
The exact requirements for this stage will depend on your specific strategic goals. But it’s likely that you’ll need more information about the purposes of your marketing spending (so you can show which funds are supporting which strategic goals) and more about lead attributes and behaviors (so you can show that results are in line with expectations).
Incidentally, demonstrating strategic alignment doesn’t depend directly understanding the buying process (stage 3) or optimizing results (stage 4). So a company that has reached stage 2 in the maturity model could jump immediately to demonstrating strategic alignment if desired.
Final Thought: once you get past counting response, all later stages in the maturity model assume you are measuring your marketing performance against the ultimate goals of closed sales and long-term customer value. This is increasingly necessary as marketing remains involved with leads even after they are officially transferred to sales. It implies that marketing and sales must integrate their systems, so they can view, coordinate, analyze and ultimately optimize sales and marketing activities across the entire buying cycle.
In companies where the marketing's responsibility still ends with the hand-off of qualified leads to sales, the maturity model could be adjusted to optimize only through that stage. But that's an increasingly obsolete approach.
I’ll be talking about marketing measurement this Tuesday at Silverpop’s B2B Marketing University seminar in Palo Alto, with a repeat performance in Boston on November 4. The core of my presentation will be a 5-step measurement maturity model for B2B marketers. This post will give you a brief summary.
A little background: marketers’ objectives for performance measurement generally fall into five broad categories: measure response, show business impact, track the buying process, optimize results and demonstrate marketing alignment with business strategy. Each category has different requirements for data, systems, measures, and processes. Because some of these requirements overlap, there’s a natural progression starting with the simplest requirements and adding new requirements for each stage. This progression leads to a maturity model. Here are the details.
1. Measure Response. The most basic requirement is simply to count the number of responses to each marketing program. This stage also includes the closely related step of calculating the cost of those responses for a simple cost-per-response measure that can be used for a rough ranking of investments.
Key data needs for this stage include mechanisms to capture responses and campaign costs and to link responses to campaigns. This requires a campaign management system to execute the campaigns and track their costs, and a marketing database that stores the identity, promotion history and response history of leads generated by the campaigns.
2. Show Business Impact of Marketing Campaigns. The cost per response tells little about the business impact of a marketing program. You must also know the value of those responses. At a minimum, this requires linking marketing leads to closed sales. This typically means importing closed opportunity records from a sales automation system and linking those opportunities back to the original marketing lead. Add the cost data already gathered in stage 1 (response measurement) and you can calculate a simple Return on Investment based on revenue / acquisition cost.
Of course, true ROI is based on profits, not revenue, and incorporates all incremental costs, not just the initial marketing expense. A proper business impact measurement thus requires capturing the full marketing, sales and product costs associated with new leads, as well as their actual or estimated long-term value. These give a ROI measure that comes reasonably close to showing the true business impact of each acquisition campaign.
In terms of new requirements, this step adds sales opportunity data, which implies integration with a sales force automation or CRM system. It also requires processes to assign opportunities to leads and leads to campaigns, and, optionally, ways to import and connect lifetime costs and revenues.
Keep in mind that this approach only applies to lead acquisition campaigns, not to campaigns that nurture existing leads or customers, or branding campaigns that don’t generate a direct response. This is a smaller issue for B2B marketers than many consumer marketers, who often have no direct way to identify the customers acquired or influenced by their activities.
3. Understand the Buying Process. This stage looks at the impact of non-acquisition marketing treatments on moving customers through the buying process. It requires defining stages within the buying process, tracking the movement of individual leads through those stages over time, recording the marketing treatments applied to those individuals, and measuring the correlation (if any) of treatments to stage changes. The result is both a more detailed understanding of the buying process and a way to decide which treatments are most valuable.
Meeting these requirements implies capturing more information about leads, including static attributes (company, job title, etc.) and behaviors such as Web site visits and email responses. These can be used in scoring models or other tools that decide which stage a lead is in at any given moment. The system must also keep a history of each lead’s stages over time, so it can correlate stage changes with treatments. The treatments themselves are already captured in the marketing database needed for response measurement, so they do not represent a new requirement.
4. Optimize Results. Once you’re tracking lead movement through process stages and measuring the impact of individual treatments, you’re ready to build an end-to-end model that calculates the impact of each small change on final sales. You can then optimize the combination of treatments across the process. For example, you might find you can spend less on acquiring new leads if you spend more on nurturing existing ones, to produce the same sales volume at lower cost.
The calculations for this type of optimization are fairly simple, and they don’t require any new information beyond the previous stage in the maturity model. But you do need more precise information about the impact of different treatments, which means formal testing of alternative treatments and careful analysis of results. You’ll also need a business simulation model that can estimate the impact of changes on near-term revenues and costs, since the company still has its quarterly targets to hit. You'll also need to define you goals -- higher revenue? higher profit rate? lower marketing costs? -- so you know what to optimize.
Ideally, you’ll also add optimization software that can automatically find the best of all possible treatment combinations. But few B2B marketers have the data volume or statistical skills required for this, so you’ll probably end up manually running a variety of scenarios through your simulation model instead.
5. Demonstrate Strategic Alignment. Delivering the optimal set of treatments won’t satisfy your CEO if your marketing programs don’t align with the larger business strategy. That alignment may in fact require campaigns that produce low short-term returns, such as investing in a new product or market segment.
To demonstrate alignment, you must first show that your planned marketing activities support business goals, and then show that those activities have yielded the expected results. For example, a strategy based on selling to a new group of customers might yield a marketing plan with 10% of acquisition spending aimed at generating leads from that segment, and a goal of that segment accounting for 5% of new leads received.
The exact requirements for this stage will depend on your specific strategic goals. But it’s likely that you’ll need more information about the purposes of your marketing spending (so you can show which funds are supporting which strategic goals) and more about lead attributes and behaviors (so you can show that results are in line with expectations).
Incidentally, demonstrating strategic alignment doesn’t depend directly understanding the buying process (stage 3) or optimizing results (stage 4). So a company that has reached stage 2 in the maturity model could jump immediately to demonstrating strategic alignment if desired.
Final Thought: once you get past counting response, all later stages in the maturity model assume you are measuring your marketing performance against the ultimate goals of closed sales and long-term customer value. This is increasingly necessary as marketing remains involved with leads even after they are officially transferred to sales. It implies that marketing and sales must integrate their systems, so they can view, coordinate, analyze and ultimately optimize sales and marketing activities across the entire buying cycle.
In companies where the marketing's responsibility still ends with the hand-off of qualified leads to sales, the maturity model could be adjusted to optimize only through that stage. But that's an increasingly obsolete approach.
Tuesday, July 07, 2009
LucidEra's Failure: More Evidence that Marketers Won't Pay for Measurement
I’m just catching up with what happened while I was on vacation these past two weeks. One piece of news is the demise of LucidEra, which this blog profiled almost exactly one year ago. According to SearchDataManagement.com, the company said it shut down because it couldn’t raise new funds or find a buyer.
There has been some learned discussion of the causes of LucidEra’s collapse on Timo Elliot’s BI Questions Blog. Much seems to focus on the apparent operating costs. These must have been substantial, since the company raised $15.6 million in 2007 and, presumably, has since spent it all.
Still, I think the fundamental problem was a lack of customers. When I spoke with LucidEra in June 2008 they said they had about 40 paying clients. When I spoke with them again in October 2008, the number was 50 and it was still at 50 when we spoke in April 2009. In other words, LucidEra was making very few sales or, even worse, was able to make new sales but couldn’t retain its customers. [For more insight based on comments by LucidEra managers, see this post on the Datadoodle blog.]
With the benefit of 20/20 hindsight, LucidEra’s strategic decision to focus on building sales analysis applications primarily for Salesforce.com was a mistake. Bear in mind that there are about 60,000 Salesforce.com customers – selling to 50 of them is less than 0.1% penetration.
I suspect LucidEra’s price point, around $3,000 per month depending on the details, was too rich for many of its prospective clients. Not that they couldn’t actually afford it – but they didn’t want to spend that much money on sales analysis.
This is not surprising. I reluctantly concluded some time ago that marketers (and presumably sales managers) are not willing to spend money on measurement systems even though they consistently say in surveys that better measurement is a high priority. For recent evidence along these lines, see the 2009 Marketing ROI and Measurements Study published by Lenskold Group and sponsored by MarketSphere, which found that “6 in 10 firms (59%) indicate having an increased demand for marketing measurements, analysis and reporting in 2009 without the budget necessary for those measurement efforts.”
Many analysts and other on-demand business intelligence vendors have been quick to assert that LucidEra’s failure does not reflect a problem with the notion of on-demand BI in general. I agree, since I see the key to LucidEra's demise as its uniquely narrow focus on sales analysis. Indeed, competitors including Birst and GoodData have leapt to offer a new home to orphaned LucidEra clients.
Still, the apparently high costs to sustain a small client base suggests the economics of this business are not as attractive as they seem. LucidEra's Darren Cunningham did tell me that their costs were particularly high because they were not a multi-tenant solution and had to manage the entire BI stack to support a single application. Presumably other on-demand BI vendors can run more cheaply. Still there does seem to be a little more reason for caution in approaching on-demand BI vendors, even though there is not (yet) any cause for alarm.
There has been some learned discussion of the causes of LucidEra’s collapse on Timo Elliot’s BI Questions Blog. Much seems to focus on the apparent operating costs. These must have been substantial, since the company raised $15.6 million in 2007 and, presumably, has since spent it all.
Still, I think the fundamental problem was a lack of customers. When I spoke with LucidEra in June 2008 they said they had about 40 paying clients. When I spoke with them again in October 2008, the number was 50 and it was still at 50 when we spoke in April 2009. In other words, LucidEra was making very few sales or, even worse, was able to make new sales but couldn’t retain its customers. [For more insight based on comments by LucidEra managers, see this post on the Datadoodle blog.]
With the benefit of 20/20 hindsight, LucidEra’s strategic decision to focus on building sales analysis applications primarily for Salesforce.com was a mistake. Bear in mind that there are about 60,000 Salesforce.com customers – selling to 50 of them is less than 0.1% penetration.
I suspect LucidEra’s price point, around $3,000 per month depending on the details, was too rich for many of its prospective clients. Not that they couldn’t actually afford it – but they didn’t want to spend that much money on sales analysis.
This is not surprising. I reluctantly concluded some time ago that marketers (and presumably sales managers) are not willing to spend money on measurement systems even though they consistently say in surveys that better measurement is a high priority. For recent evidence along these lines, see the 2009 Marketing ROI and Measurements Study published by Lenskold Group and sponsored by MarketSphere, which found that “6 in 10 firms (59%) indicate having an increased demand for marketing measurements, analysis and reporting in 2009 without the budget necessary for those measurement efforts.”
Many analysts and other on-demand business intelligence vendors have been quick to assert that LucidEra’s failure does not reflect a problem with the notion of on-demand BI in general. I agree, since I see the key to LucidEra's demise as its uniquely narrow focus on sales analysis. Indeed, competitors including Birst and GoodData have leapt to offer a new home to orphaned LucidEra clients.
Still, the apparently high costs to sustain a small client base suggests the economics of this business are not as attractive as they seem. LucidEra's Darren Cunningham did tell me that their costs were particularly high because they were not a multi-tenant solution and had to manage the entire BI stack to support a single application. Presumably other on-demand BI vendors can run more cheaply. Still there does seem to be a little more reason for caution in approaching on-demand BI vendors, even though there is not (yet) any cause for alarm.
Tuesday, April 15, 2008
Making Some Changes
Maybe it's that spring has finally arrived, but, for whatever reason, I have several changes to announce.
- I've also started a new blog "MPM Toolkit" at http://mpmtoolkit.blogspot.com/. In this case, MPM stands for Marketing Performance Measurement. This has a been a topic of growing professional interest to me; in fact, I have a book due out on the topic this fall (knock wood). I felt the subject was different enough from what I've been writing about here to justify a blog of its own. Trying to keep the brand messages clear, as it were.
- I have resumed working under the Raab Associates Inc. umbrella, and am now a consultant rather than partner with Client X Client. This has more to do with accounting than anything else. It does, however, force me to revisit my portion of the Raab Associates Web site, which has not been updated since the (Bill) Clinton Administration. I'll probably set up a new separate site fairly soon.
Sorry to bore you with personal details. I'll make a more substantive post tomorrow.
- Most obviously, I've changed the look of this blog itself. Partly it's because I was tired of the old look, but mostly it's to allow me to take advantage of new capabilities now provided by Blogger. The most interesting is a new polling feature. You'll see the first poll at the right.
- I've also started a new blog "MPM Toolkit" at http://mpmtoolkit.blogspot.com/. In this case, MPM stands for Marketing Performance Measurement. This has a been a topic of growing professional interest to me; in fact, I have a book due out on the topic this fall (knock wood). I felt the subject was different enough from what I've been writing about here to justify a blog of its own. Trying to keep the brand messages clear, as it were.
- I have resumed working under the Raab Associates Inc. umbrella, and am now a consultant rather than partner with Client X Client. This has more to do with accounting than anything else. It does, however, force me to revisit my portion of the Raab Associates Web site, which has not been updated since the (Bill) Clinton Administration. I'll probably set up a new separate site fairly soon.
Sorry to bore you with personal details. I'll make a more substantive post tomorrow.
Tuesday, October 02, 2007
Marketing Performance Measurement: No Answers to the Really Tough Questions
I recently ran a pair of two-day workshops on marketing performance measurement. My students had a variety of goals, but the two major ones they mentioned were the toughest issues in marketing: how to allocate resources across different channels and how to measure the impact of marketing on brand value.
Both questions have standard answers. Channel allocation is handled by marketing mix models, which analyze historical data to determine the relative impact of different types of spending. Brand value is measured by assessing the important customer attitudes in a given market and how a particular brand matches those attitudes.
Yet, despite my typically eloquent and detailed explanations, my students found these answers unsatisfactory. Cost was one obstacle for most of them; lack of data was another. They really wanted something simpler.
I’d love to report I gave it to them, but I couldn't. I had researched these topics thoroughly as preparation for the workshops and hadn’t found any alternatives to the standard approaches; further research since then still hasn’t turned up anything else of substance. Channel allocation and brand value are inherently complex and there just are no simple ways to measure them.
The best I could suggest was to use proxy data when a thorough analysis is not possible due to cost or data constraints. For channel allocation, the proxy might be incremental return on investment by channel: switching funds from low ROI to high ROI channels doesn’t really measure the impact of the change in marketing mix, but it should lead to an improvement in the average level of performance. Similarly, surveys to measure changes in customer attitudes toward a brand don’t yield a financial measure of brand value, but do show whether it is improving or getting worse. Some compromise is unavoidable here: companies not willing or able to invest in a rigorous solution must accept that their answers will be imprecise.
This round of answers was little better received than the first. Even ROI and customer attitudes are not always available, and they are particularly hard to measure in multi-channel environments where the result of a particular marketing effort cannot easily be isolated. You can try still simpler measures, such as spending or responses for channel performance or market share for brand value. But these are so far removed from the original question that it’s difficult to present them as meaningful answers.
The other approach I suggested was testing. The goal here is to manufacture data where none exists, thereby creating something to measure. This turned out to be a key concept throughout the performance measurement discussions. Testing also shows that marketers are at least doing something rigorous, thereby helping satisfy critics who feel marketing investments are totally arbitrary. Of course, this is a political rather than analytical approach, but politics are important. The final benefit of testing is it gives a platform for continuous improvement: even though you may not know the absolute value of any particular marketing effort, a test tells whether one option or another is relatively superior. Over time, this allows a measurable gain in results compared with the original levels. Eventually it may provide benchmarks to compare different marketing efforts against each other, helping with both channel allocation and brand value as well.
Even testing isn’t always possible, as my students were quick to point out. My answer at that point was simply that you have to seek situations where you can test: for example, Web efforts are often more measurable than conventional channels. Web results may not mirror results in other channels, because Web customers may themselves be very different from the rest of the world. But this again gets back to the issue of doing the best with the resources at hand: some information is better than none, so long as you keep in mind the limits of what you’re working with.
I also suggested that testing is more possible than marketers sometimes think, if they really make testing a priority. This means selecting channels in part on the basis of whether testing is possible; designing programs so testing is built in; and investing more heavily in test activities themselves (such as incentives for survey participants). This approach may ultimately lead to a bias in favor of testable channels—something that seems excessive at first: you wouldn’t want to discard an effective channel simply because you couldn’t test it. But it makes some sense if you realize that testable channels can be improved continuously, while results in untestable channels are likely to stagnate. Given this dynamic, testable channels will sooner or later become more productive than untestable channels. This holds even if the testable channels are less efficient at the start.
I offered all these considerations to my students, and may have seen a few lightbulbs switch on. It was hard to tell: by the time we had gotten this far into the discussion, everyone was fairly tired. But I think it’s ultimately the best advice I could have given them: focus on testing and measuring what you can, and make the best use possible of the resulting knowledge. It may not directly answer your immediate questions, but you will learn how to make the most effective use of your marketing resources, and that’s the goal you are ultimately pursuing.
Both questions have standard answers. Channel allocation is handled by marketing mix models, which analyze historical data to determine the relative impact of different types of spending. Brand value is measured by assessing the important customer attitudes in a given market and how a particular brand matches those attitudes.
Yet, despite my typically eloquent and detailed explanations, my students found these answers unsatisfactory. Cost was one obstacle for most of them; lack of data was another. They really wanted something simpler.
I’d love to report I gave it to them, but I couldn't. I had researched these topics thoroughly as preparation for the workshops and hadn’t found any alternatives to the standard approaches; further research since then still hasn’t turned up anything else of substance. Channel allocation and brand value are inherently complex and there just are no simple ways to measure them.
The best I could suggest was to use proxy data when a thorough analysis is not possible due to cost or data constraints. For channel allocation, the proxy might be incremental return on investment by channel: switching funds from low ROI to high ROI channels doesn’t really measure the impact of the change in marketing mix, but it should lead to an improvement in the average level of performance. Similarly, surveys to measure changes in customer attitudes toward a brand don’t yield a financial measure of brand value, but do show whether it is improving or getting worse. Some compromise is unavoidable here: companies not willing or able to invest in a rigorous solution must accept that their answers will be imprecise.
This round of answers was little better received than the first. Even ROI and customer attitudes are not always available, and they are particularly hard to measure in multi-channel environments where the result of a particular marketing effort cannot easily be isolated. You can try still simpler measures, such as spending or responses for channel performance or market share for brand value. But these are so far removed from the original question that it’s difficult to present them as meaningful answers.
The other approach I suggested was testing. The goal here is to manufacture data where none exists, thereby creating something to measure. This turned out to be a key concept throughout the performance measurement discussions. Testing also shows that marketers are at least doing something rigorous, thereby helping satisfy critics who feel marketing investments are totally arbitrary. Of course, this is a political rather than analytical approach, but politics are important. The final benefit of testing is it gives a platform for continuous improvement: even though you may not know the absolute value of any particular marketing effort, a test tells whether one option or another is relatively superior. Over time, this allows a measurable gain in results compared with the original levels. Eventually it may provide benchmarks to compare different marketing efforts against each other, helping with both channel allocation and brand value as well.
Even testing isn’t always possible, as my students were quick to point out. My answer at that point was simply that you have to seek situations where you can test: for example, Web efforts are often more measurable than conventional channels. Web results may not mirror results in other channels, because Web customers may themselves be very different from the rest of the world. But this again gets back to the issue of doing the best with the resources at hand: some information is better than none, so long as you keep in mind the limits of what you’re working with.
I also suggested that testing is more possible than marketers sometimes think, if they really make testing a priority. This means selecting channels in part on the basis of whether testing is possible; designing programs so testing is built in; and investing more heavily in test activities themselves (such as incentives for survey participants). This approach may ultimately lead to a bias in favor of testable channels—something that seems excessive at first: you wouldn’t want to discard an effective channel simply because you couldn’t test it. But it makes some sense if you realize that testable channels can be improved continuously, while results in untestable channels are likely to stagnate. Given this dynamic, testable channels will sooner or later become more productive than untestable channels. This holds even if the testable channels are less efficient at the start.
I offered all these considerations to my students, and may have seen a few lightbulbs switch on. It was hard to tell: by the time we had gotten this far into the discussion, everyone was fairly tired. But I think it’s ultimately the best advice I could have given them: focus on testing and measuring what you can, and make the best use possible of the resulting knowledge. It may not directly answer your immediate questions, but you will learn how to make the most effective use of your marketing resources, and that’s the goal you are ultimately pursuing.
Subscribe to:
Posts (Atom)