Summary: Treehouse Interactive has been slowly enhancing its marketing automation system with features that appeal to experienced users. Its new clients are larger firms and half are switching from another marketing automation product that they found inadequate. This might foreshadow attrition problems at other vendors.
It’s been nearly two years since my last review of Treehouse Interactive. Here's an update.
The big news is, well, that there’s no big news. Treehouse has been quietly but steadily growing its business (up 30% this year), improving its product, and attracting more demanding clients. One telling statistic is that about half its new customers are replacing an existing marketing automation system – a sure sign that Treehouse offers features that only an experienced marketer will realize are missing from other products.
A bit of background: Treehouse started in 1997 with the Sales View sales automation product. It added Marketing View marketing automation in 1999 and Reseller View partner management after that. Its marketing automation system offers the usual range of functions: email, Web analytics, landing pages, multi-step campaigns, lead scoring, CRM integration, ROI reporting. The greatest divergence from industry norms is Treehouse contacts always enter campaigns by completing a form. Other systems select campaign members with rules that can access a broader set of data.
In addition, Treehouse originally required all subsequent campaign steps to execute the same actions on the same schedule. This is considerably more rigid than the branching capabilities built into most marketing automation products. Treehouse has since enabled imported data to trigger campaign actions, and promises behavior-based triggers in the near future. See my original post for more details.
Treehouse’s developments since that post have largely played to its strengths. I’ll group these into themes, with the caveat that I’m combining enhancements introduced at different times in the past year and a half.
- form integration. Treehouse has continued to expand how clients can use its forms, which were already more powerful than most. The system can now generate HTML code to embed forms within external Web pages, allowing users to create standard Javascript or Facebook-compatible non-Javascript versions, or both. It can also post form responses using HTTP Send commands, which can send data to GoToWebinar (replacing GoToWebinar’s own registration forms) or to other systems such as product registration, CRM and customer support. The HTTP Send avoids API calls or Web Services, although Treehouse offers data exchange through Web Services as well. The system also has an “instant polling” feature to embed surveys within any Web page.
- CRM synchronization. When I last wrote about Treehouse, it had just added Salesforce.com integration. It has since added a connector for Oracle CRM On Demand. It has also improved its CRM integration to synchronize data in real time, show Treehouse events within the CRM interface, and allow salespeople to add leads to campaigns and remove them. CRM integration is handled through forms that map fields from one system to another. These forms also contain update rules (controlling when data from one system replaces data in the other) and action rules (specifying when to take actions such as sending an email or updating a list subscription). The action rules are particularly significant in the context of Treehouse’s forms-based campaign design, since they provide a way to modify lead treatments that isn’t based on the original form entries.
- Web analytics. The system now builds separate Web activity profiles for individuals (whether identified or anonymous, so long as they have a cookie), for all individuals associated with a company, and for companies identified via IP address but lacking an associated individual. An individual’s lead score can be based on both individual and company Web behaviors. The system has expanded its referral reporting to track results by the exact referring URL. The CRM integration can now capture the search phrase and other referral details for leads imported from Salesforce.com Web to Lead forms: this required special processing since Salesforce.com embeds the information within a text string.
- download and document management. Treehouse can now tie multiple downloads to a single request form. It can list the leads that downloaded a specific document (a feature Treehouse says is unique, although I can only confirm that it's rare), as well as counting total downloads and downloads by unique leads. Downloads are now part of contact history along with emails, campaigns, purchases, click-throughs and form actions. The system also maintains a library of available documents. These can be stored outside of Treehouse so long as there’s a tag for Treehouse to call them.
- social media integration. Marketing messages can include a button that lets recipients create social media messages with an embedded URL. The messages will be sent under the recipient’s own identity in systems including Facebook, MySpace, Twitter, LinkedIn and Digg. Although many demand generation vendors now offer some type of social sharing, Treehouse introduced this feature back in May 2009. Emails and forms can also include a forward-to-a-friend button that allows recipients to enter several email addresses at once.
- other advanced features. These include fine-grained access permissions, split and multivariate testing, easy addition of new tables linked to contact records, and support for non-Roman languages such as Chinese. All are features particularly relevant to larger or more sophisticated clients.
Treehouse pricing has changed a bit since my original post, now starting at $749 per month for up to 7,500 contacts in the database. This is still firmly in small business territory, although Treehouse’s advanced features really make it a better fit for more sophisticated marketers, who are usually at larger companies. The company is a particularly good fit for channel marketers who can benefit from its Reseller View system.
Treehouse now has nearly 200 total clients, of which more than half use Marketing View. This makes it one of the smaller players competing for mid-to-upper size clients, a particularly crowded niche. But the firm is self-funded and profitable, and it's selling on features, not cost. So I'd expect it to be a reliable vendor, even if someone else eventually dominates its segment.
Monday, November 29, 2010


Tuesday, November 23, 2010
Alterian Alchemy Knits Together Marketing Components
Summary: Alterian just announced Alchemy, which provides a new interface and tight integration across existing components.
Alterian last week announced a new generation of products called Alchemy. It’s positioning these as “customer engagement solutions” rather than “campaign management” solutions. The general idea seems to be that customer engagement involves digital dialogs while traditional campaign management is mostly about outbound messages.
Happily, there’s more here than new labels. The main changes, set for release next March, are:
- an integrated framework to share customer information and marketing data (campaign plans, contents, etc.) across channels. This is supported by a new capability to read data in Microsoft SQL Server databases without first loading it into Alterian’s own database engine.
- a new user interface built using the Microsoft Silverlight platform. This is highly configurable and includes specific new tools for building queries, campaigns, and dashboards. The campaign builder in particular has been updated to support trigger-driven, multi-step processes in a branching flow chart.
The company also plans to expand integration with KXEN for predictive analytics, although it hasn’t set a release date.
Alchemy will also include revised and expanded versions of Alterian's social media, Web content management, Web analytics, and email solutions. These will be released throughout the first half of next year. A detailed roadmap is available in the Alchemy FAQ.
Pricing for Alchemy hasn’t been announced, but it will be somewhat higher than current Alterian products. The old products will remain available to serve what Alterian now refers to as “traditional” marketers.
Alchemy is a bit tough to assess. It doesn't add many new functions, but Alterian already had an extremely broad set of capabilities. I think what’s really happening is it knits together products that Alterian had previously acquired but not truly integrated. This is delivering on an old promise, not creating a revolution. Still, it should let marketers do a substantially better job at managing customer relationships across all channels. Revolutionary or not, that's an improvement well worth having.
Alterian last week announced a new generation of products called Alchemy. It’s positioning these as “customer engagement solutions” rather than “campaign management” solutions. The general idea seems to be that customer engagement involves digital dialogs while traditional campaign management is mostly about outbound messages.
Happily, there’s more here than new labels. The main changes, set for release next March, are:
- an integrated framework to share customer information and marketing data (campaign plans, contents, etc.) across channels. This is supported by a new capability to read data in Microsoft SQL Server databases without first loading it into Alterian’s own database engine.
- a new user interface built using the Microsoft Silverlight platform. This is highly configurable and includes specific new tools for building queries, campaigns, and dashboards. The campaign builder in particular has been updated to support trigger-driven, multi-step processes in a branching flow chart.
The company also plans to expand integration with KXEN for predictive analytics, although it hasn’t set a release date.
Alchemy will also include revised and expanded versions of Alterian's social media, Web content management, Web analytics, and email solutions. These will be released throughout the first half of next year. A detailed roadmap is available in the Alchemy FAQ.
Pricing for Alchemy hasn’t been announced, but it will be somewhat higher than current Alterian products. The old products will remain available to serve what Alterian now refers to as “traditional” marketers.
Alchemy is a bit tough to assess. It doesn't add many new functions, but Alterian already had an extremely broad set of capabilities. I think what’s really happening is it knits together products that Alterian had previously acquired but not truly integrated. This is delivering on an old promise, not creating a revolution. Still, it should let marketers do a substantially better job at managing customer relationships across all channels. Revolutionary or not, that's an improvement well worth having.
Friday, November 19, 2010
More on Marketo Financials: Despite Past Losses, Prospects Are Bright
Summary: Public data gives some insights into Marketo's financial history and prospects. Despite past losses, the company is in a strong position to continue to compete aggressively. (Note: as Marketo has commented below, this article is based on my own analysis and was written without access to Marketo's actual financial information.)
Here’s a bit more on this week's $25 million investment in Marketo: a piece in VentureWire quotes revenue for Markteo as $4.5 million for 2009 and "triple that" ($13.5 million) for 2010. This is the first time I've seen published revenue figures for the company. They allow for some interesting analysis.
Data I've collected over the years shows that Marketo had about 120 clients at the start of 2009, 325 at the start of 2010, and should end 2010 with about 800. Doing a bit of math, this yields average counts of 222 for 2009 and 562 for 2010, which in turn shows average revenue per client of $20,000 per year or $1,700 per month in 2009 and $24,000 or $2,000 per month in 2010. The table below throws in a reasonable guess for 2008 as well.
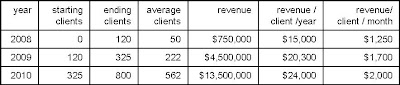 Given that Marketo’s list prices start at $2,000 per month for the smallest implementation of its full-featured edition, this is pretty firm evidence that the company has indeed been aggressively discounting its system – as competitors have long stated.
(Some competitors have also said that Marketo's reported client counts are cumulative new clients, without reductions for attrition. If so, the revenue per active client would actually be a bit higher than I've calculated here. But Marketo itself says the reported figures are indeed active clients and I've no basis to doubt them. The following analysis wouldn't change much either way.)
If you’ll accept a bit more speculation, we can even estimate the size of those discounts. That same VentureWire article quotes Marketo’s current headcount as 130 employees, compared with half that number at the start of the year. Assume there were 70 at the start of 2010 (which matches my own data) and will be 140 by year-end, for an average of 105. My records suggest that the headcount at the start of the 2009 was around 35, so the average headcount for that year was about 52.
Let’s assume a "normal" revenue of $200,000 per employee, which is about typical for software companies (and matches published figures for Marketo competitors Aprimo and Unica). That means Marketo revenues without discounting “should” have been about $10.4 million in 2009 and $21 million in 2010. Compared with actual revenues, this shows 2009 revenue was about 43% of the “normal” price ($4.5 million actual vs. $10.4 million expected) and 2010 revenue at about 64% ($13.5 million vs. $21 million).
So the good news for Marketo’s new investors is that Marketo has been discounting less (although there’s an alternative explanation that we’ll get to in a minute). The bad news is they have quite a way to go before they’re selling at full price.
 We can use the same data to estimate Marketo’s burn rate. Costs are likely to be very close to the same $200,000 per employee (this includes everything, not just salary). My records suggest the company had about 25 average employees in 2008, for $5 million in expenses. Marketo was founded in late 2005, so let’s figure it averaged 10 employees during the previous two years, and that they cost only $150,000 because the early stage doesn’t involve marketing costs. This adds another $3 million. That gives a cumulative investment of $39.4 million.
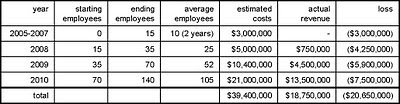 We already know revenue for 2009 and 2010 will be about $18 million. The company started selling in late February 2008 and my records show it ended that year with 120 clients. Assume the equivalent of 50 annual clients at $15,000 and you get 2008 revenue of $750,000, for $18.75 million total. That leaves a gap of $20.65 million between life-to-date costs vs. revenues.
This nicely matches the “approximately $20 million” investment to date that Marketo CEO Phil Fernandez reportedin his own blog post on the new funding.
Now you can see why Marketo needed more money: its losses are actually growing despite having more customers and improved pricing. It lost nearly $16,000 for each new client last year ($7.5 million loss on 475 new clients). At that rate, even a modest increase in the number of new clients would have burned through nearly all of the company’s remaining $12 million within one year.
This isn’t just a matter of scale. It’s true that a start-up has to spread its fixed costs over a small number of clients, yielding a high cost per client during the early stages. Marketo shows this effect: the number of clients per employee has grown started at 3.4 at the end of 2008 and dropped to 5.7 at the end of 2010. This is the alternative to discounting as an explanation for those ratios of "normal" to actual revenue (remember: “normal” revenue based on number of employees).
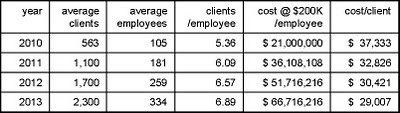
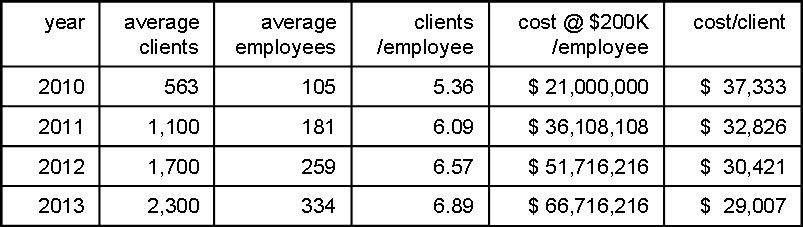
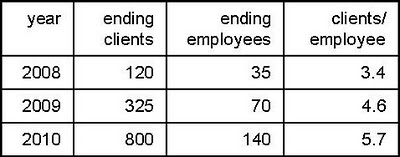 But the client/employee ratio can’t improve indefinitely. Many costs are not fixed: staffing for customer support, marketing, sales and administrative functions will all increase as clients are added. To get some idea of Marketo's variable costs, compare the change in employees with the change in clients. This is improving more slowly:
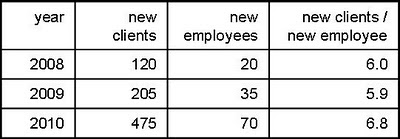 And here’s the problem: at 1 new employee for every 6.8 clients, Marketo is adding $200,000 in cost for just $163,000 in revenue (=6.8 x $24,000 / client). It truly does lose money on each new customer. You can’t grow your way out of that.
So what happens now? Let’s assume Marketo gets a bit more efficient and the new clients to new employee ratio eventually tops out at a relatively optimistic 8. At a cost of $200,000 per employee, those clients have to generate $25,000 in revenue for Marketo just to cover the increased expense. This is just a bit higher than the current $24,000 per client, so it seems pretty doable. But it leaves the existing $7.5 million annual loss in place forever.
In other words, Marketo must substantially increase revenue per client to become profitable. (In theory, Marketo could also cut costs. But the main controllable cost is sales and marketing, and incremental cost per sale is likely to rise as the company enters new markets and faces stiffer competition while pushing for continued growth. So higher revenue is the only real option.)
Revenue per client can be increased through higher prices, new products, and/or bigger clients. Pricing will be constrained by competition, although Marketo could probably discount a bit less. This leaves new products and bigger clients. Those are exactly the areas that Marketo is now pursuing through add-ons such as Revenue Cycle Analytics and Sales Insight, and enhancements for large companies in its Enterprise Edition. So, in my humble opinion, they're doing exactly the right things.
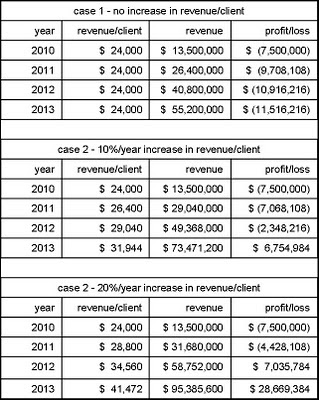
Some back-of-envelope calculations confirm that revenue per client is by far the most important variable in Marketo’s financial future. The following tables use some reasonable assumptions about growth in clients and clients per employee; take my word for it that the results don’t change much if you modify these. But results change hugely depending on what happens to revenue per client: losses continue indefinitely if it remains at the current $24,000 per year; they continue for two years and total $10 million if it increases at 10% per year; and they end after one year and $4.4 million if it grows at 20% per year. Bear in mind that revenue per customer did grow 20% from 2009 to 2010 ($20,000 to $24,000). So I’d expect it to continue rising sharply as Marketo firms up its pricing and starts acquiring larger clients.
 Indeed, these figures raise the unexpected (to me) question of whether $25 million in funding is more than Marketo will need. I’d guess the company’s management and current investors were careful not to dilute their equity any more than necessary, so I think they’re planning some heavy investments that are not factored into my assumptions. In fact, the company has said as much: the VentureWire piece quotes Fernandez as stating the new funds will be used for additional sales and marketing staff, to open offices abroad, to integrate with other vendors and launch vertical services in sectors like health care and financial services.
I also expect continued aggressive pricing (perhaps more selectively than in the past) and maybe some acquisitions. It's possible that Marketo will also expand its own professional services staff, since clients definitely need help with adoption. But that would conflict with its existing channel partners so it would need to move carefully.
What does it all mean? Here are my conclusions:
- Marketo's losses reflect a conscious strategy to grow quickly through aggressive pricing. There is no fundamental problem with its cost structure: company could be profitable fairly quickly if it decided to slow down and raise prices.
- Marketo's future lies in the middle and upper tiers of the market. Its pressing financial need is to raise revenue per client, which will lead it away from the low-cost, bitterly competitive market serving very small businesses.
- The new funding will support an expanded marketing and product push. Competing with Marketo in its target segments is going to be a challenge indeed.
Here’s a bit more on this week's $25 million investment in Marketo: a piece in VentureWire quotes revenue for Markteo as $4.5 million for 2009 and "triple that" ($13.5 million) for 2010. This is the first time I've seen published revenue figures for the company. They allow for some interesting analysis.
Data I've collected over the years shows that Marketo had about 120 clients at the start of 2009, 325 at the start of 2010, and should end 2010 with about 800. Doing a bit of math, this yields average counts of 222 for 2009 and 562 for 2010, which in turn shows average revenue per client of $20,000 per year or $1,700 per month in 2009 and $24,000 or $2,000 per month in 2010. The table below throws in a reasonable guess for 2008 as well.
 Given that Marketo’s list prices start at $2,000 per month for the smallest implementation of its full-featured edition, this is pretty firm evidence that the company has indeed been aggressively discounting its system – as competitors have long stated.
(Some competitors have also said that Marketo's reported client counts are cumulative new clients, without reductions for attrition. If so, the revenue per active client would actually be a bit higher than I've calculated here. But Marketo itself says the reported figures are indeed active clients and I've no basis to doubt them. The following analysis wouldn't change much either way.)
If you’ll accept a bit more speculation, we can even estimate the size of those discounts. That same VentureWire article quotes Marketo’s current headcount as 130 employees, compared with half that number at the start of the year. Assume there were 70 at the start of 2010 (which matches my own data) and will be 140 by year-end, for an average of 105. My records suggest that the headcount at the start of the 2009 was around 35, so the average headcount for that year was about 52.
Let’s assume a "normal" revenue of $200,000 per employee, which is about typical for software companies (and matches published figures for Marketo competitors Aprimo and Unica). That means Marketo revenues without discounting “should” have been about $10.4 million in 2009 and $21 million in 2010. Compared with actual revenues, this shows 2009 revenue was about 43% of the “normal” price ($4.5 million actual vs. $10.4 million expected) and 2010 revenue at about 64% ($13.5 million vs. $21 million).
So the good news for Marketo’s new investors is that Marketo has been discounting less (although there’s an alternative explanation that we’ll get to in a minute). The bad news is they have quite a way to go before they’re selling at full price.
 We can use the same data to estimate Marketo’s burn rate. Costs are likely to be very close to the same $200,000 per employee (this includes everything, not just salary). My records suggest the company had about 25 average employees in 2008, for $5 million in expenses. Marketo was founded in late 2005, so let’s figure it averaged 10 employees during the previous two years, and that they cost only $150,000 because the early stage doesn’t involve marketing costs. This adds another $3 million. That gives a cumulative investment of $39.4 million.
 We already know revenue for 2009 and 2010 will be about $18 million. The company started selling in late February 2008 and my records show it ended that year with 120 clients. Assume the equivalent of 50 annual clients at $15,000 and you get 2008 revenue of $750,000, for $18.75 million total. That leaves a gap of $20.65 million between life-to-date costs vs. revenues.
This nicely matches the “approximately $20 million” investment to date that Marketo CEO Phil Fernandez reportedin his own blog post on the new funding.
Now you can see why Marketo needed more money: its losses are actually growing despite having more customers and improved pricing. It lost nearly $16,000 for each new client last year ($7.5 million loss on 475 new clients). At that rate, even a modest increase in the number of new clients would have burned through nearly all of the company’s remaining $12 million within one year.
This isn’t just a matter of scale. It’s true that a start-up has to spread its fixed costs over a small number of clients, yielding a high cost per client during the early stages. Marketo shows this effect: the number of clients per employee has grown started at 3.4 at the end of 2008 and dropped to 5.7 at the end of 2010. This is the alternative to discounting as an explanation for those ratios of "normal" to actual revenue (remember: “normal” revenue based on number of employees).
 But the client/employee ratio can’t improve indefinitely. Many costs are not fixed: staffing for customer support, marketing, sales and administrative functions will all increase as clients are added. To get some idea of Marketo's variable costs, compare the change in employees with the change in clients. This is improving more slowly:
 And here’s the problem: at 1 new employee for every 6.8 clients, Marketo is adding $200,000 in cost for just $163,000 in revenue (=6.8 x $24,000 / client). It truly does lose money on each new customer. You can’t grow your way out of that.
So what happens now? Let’s assume Marketo gets a bit more efficient and the new clients to new employee ratio eventually tops out at a relatively optimistic 8. At a cost of $200,000 per employee, those clients have to generate $25,000 in revenue for Marketo just to cover the increased expense. This is just a bit higher than the current $24,000 per client, so it seems pretty doable. But it leaves the existing $7.5 million annual loss in place forever.
In other words, Marketo must substantially increase revenue per client to become profitable. (In theory, Marketo could also cut costs. But the main controllable cost is sales and marketing, and incremental cost per sale is likely to rise as the company enters new markets and faces stiffer competition while pushing for continued growth. So higher revenue is the only real option.)
Revenue per client can be increased through higher prices, new products, and/or bigger clients. Pricing will be constrained by competition, although Marketo could probably discount a bit less. This leaves new products and bigger clients. Those are exactly the areas that Marketo is now pursuing through add-ons such as Revenue Cycle Analytics and Sales Insight, and enhancements for large companies in its Enterprise Edition. So, in my humble opinion, they're doing exactly the right things.
Some back-of-envelope calculations confirm that revenue per client is by far the most important variable in Marketo’s financial future. The following tables use some reasonable assumptions about growth in clients and clients per employee; take my word for it that the results don’t change much if you modify these. But results change hugely depending on what happens to revenue per client: losses continue indefinitely if it remains at the current $24,000 per year; they continue for two years and total $10 million if it increases at 10% per year; and they end after one year and $4.4 million if it grows at 20% per year. Bear in mind that revenue per customer did grow 20% from 2009 to 2010 ($20,000 to $24,000). So I’d expect it to continue rising sharply as Marketo firms up its pricing and starts acquiring larger clients.
 Indeed, these figures raise the unexpected (to me) question of whether $25 million in funding is more than Marketo will need. I’d guess the company’s management and current investors were careful not to dilute their equity any more than necessary, so I think they’re planning some heavy investments that are not factored into my assumptions. In fact, the company has said as much: the VentureWire piece quotes Fernandez as stating the new funds will be used for additional sales and marketing staff, to open offices abroad, to integrate with other vendors and launch vertical services in sectors like health care and financial services.
I also expect continued aggressive pricing (perhaps more selectively than in the past) and maybe some acquisitions. It's possible that Marketo will also expand its own professional services staff, since clients definitely need help with adoption. But that would conflict with its existing channel partners so it would need to move carefully.
What does it all mean? Here are my conclusions:
- Marketo's losses reflect a conscious strategy to grow quickly through aggressive pricing. There is no fundamental problem with its cost structure: company could be profitable fairly quickly if it decided to slow down and raise prices.
- Marketo's future lies in the middle and upper tiers of the market. Its pressing financial need is to raise revenue per client, which will lead it away from the low-cost, bitterly competitive market serving very small businesses.
- The new funding will support an expanded marketing and product push. Competing with Marketo in its target segments is going to be a challenge indeed.
Wednesday, November 17, 2010
LoopFuse Captures More Web Traffic Data
Summary: LoopFuse has extended its system to capture more Web traffic data, which lays the foundation for future analytics.
LoopFuse recently released its latest enhancements, which it somewhat grandiosely labels as making it “the First and Only Marketing Automation Solution with Inbound Marketing”. In fact, as the subhead to their press release states, what they’ve really done is somewhat more modest: add “real-time Web traffic intelligence” by providing features to capture search terms, referring sites and page views, and link these to individual visitors.
The new release also adds real-time social media monitoring (directly for Twitter and Facebook, and through Collecta for blogs, YouTube and other sources).
These features are certainly useful. But my idea of "inbound marketing" is more along the lines of HubSpot, which provides search engine optimization, paid search campaign management, social media monitoring and posting, blogging, and Web content management. Although LoopFuse might eventually add those functions, it hasn't yet and isn’t necessarily moving in that direction.
Accepting their labels for the moment, let’s look at what LoopFuse has added:
- “content marketing” is a set of reports that tracks Web traffic related to different assets. Users get a list of the assets ranked by number of page views. They can then drill into each item to see a graph of traffic over time and to see details such as the number of visitors, views per visitor, and referring domains and pages. Because the views are tied to individual visitors, users can also click on the referring domain to see what other pages people from that domain visited. This is essentially the same information as provided by...
- “inbound marketing”, which shows visitor sources by category (direct links, paid search ads, organic search) and details within each category (specific messages, ads or keywords). As just noted, users can drill down to see which Web pages were viewed by visitors from each source.
- “social monitoring” provides real-time monitoring of user-selected terms on the various social Web sites. Unlike the other Web traffic data, this information isn’t stored within the LoopFuse database and isn't tied to specific individuals. LoopFuse plans to provide some trending reports in the future. Of course, the real trick would be linking social media comments to lead profiles.
All of these are valuable reports. Having them within a single system is particularly helpful for the small businesses targeted by LoopFuse, where all channels are likely to be handled by a small department and possibly the same individual. Otherwise, the users would need switch among several systems to do their job. In larger firms, where different people would be responsible for different channels, each channel can be managed by a separate system without requiring anyone to use multiple products.
Saving effort is nice, but the real value of a unified marketing database is being able to coordinate marketing messages and relate all marketing contacts to sales results. LoopFuse hasn’t publicly revealed its approach to marketing performance measurement but definitely has something in the works. I’m particularly hoping they'll use the detailed behavior information to relate outcomes to specific marketing messages, rather than just looking at movement through purchase stages. Although stage data by itself can project future revenues, it must be tied to specific marketing programs to measure those programs’ value.
In case you’re wondering, LoopFuse is storing the new Web traffic data in denormalized tables that are separate from the operational marketing database. This enables much quicker response to ad hoc queries and, should eventually support the time-based views needed for trends and stage analytics.
For those of you keeping score at home, LoopFuse’s Roy Russo also told me that the company stores each client’s data in a separate database instance. Russo said this has proven more scalable and cheaper than the textbook Software-as-a-Service approach of commingling several clients’ data in a single instance. So far as I know, most (but not all) marketing automation vendors use same approach as LoopFuse.
Russo also said that all data in the system is accessible via standard API calls, something that’s also not always possible with competitive products. In fact, Russo said LoopFuse’s entire interface is built on using the published API, which means that technically competent clients could build alternative interfaces to embed LoopFuse data and functions within other systems. If nothing else, this gets them Geek Style Points.
Of course, no discussion of LoopFuse is complete without mentioning its freemium offer, launched last June amid considerable controversy. The company says that nearly 1,000 accounts have now signed up for this, which is impressive by any standard. No news yet on how many have converted to paid.
One side effect that I hadn't anticipated – although LoopFuse apparently did – is that agencies and consultants use the freemium to service new clients, who convert to paid when their volumes grow. This gives LoopFuse an edge in the competition for channel partners. The value of that edge is a bit uncertain, though, since an increasing number of service firms – including Pedowitz Group, Annuitas and LeftBrain Marketing – are now working with multiple marketing automation vendors.
LoopFuse recently released its latest enhancements, which it somewhat grandiosely labels as making it “the First and Only Marketing Automation Solution with Inbound Marketing”. In fact, as the subhead to their press release states, what they’ve really done is somewhat more modest: add “real-time Web traffic intelligence” by providing features to capture search terms, referring sites and page views, and link these to individual visitors.
The new release also adds real-time social media monitoring (directly for Twitter and Facebook, and through Collecta for blogs, YouTube and other sources).
These features are certainly useful. But my idea of "inbound marketing" is more along the lines of HubSpot, which provides search engine optimization, paid search campaign management, social media monitoring and posting, blogging, and Web content management. Although LoopFuse might eventually add those functions, it hasn't yet and isn’t necessarily moving in that direction.
Accepting their labels for the moment, let’s look at what LoopFuse has added:
- “content marketing” is a set of reports that tracks Web traffic related to different assets. Users get a list of the assets ranked by number of page views. They can then drill into each item to see a graph of traffic over time and to see details such as the number of visitors, views per visitor, and referring domains and pages. Because the views are tied to individual visitors, users can also click on the referring domain to see what other pages people from that domain visited. This is essentially the same information as provided by...
- “inbound marketing”, which shows visitor sources by category (direct links, paid search ads, organic search) and details within each category (specific messages, ads or keywords). As just noted, users can drill down to see which Web pages were viewed by visitors from each source.
- “social monitoring” provides real-time monitoring of user-selected terms on the various social Web sites. Unlike the other Web traffic data, this information isn’t stored within the LoopFuse database and isn't tied to specific individuals. LoopFuse plans to provide some trending reports in the future. Of course, the real trick would be linking social media comments to lead profiles.
All of these are valuable reports. Having them within a single system is particularly helpful for the small businesses targeted by LoopFuse, where all channels are likely to be handled by a small department and possibly the same individual. Otherwise, the users would need switch among several systems to do their job. In larger firms, where different people would be responsible for different channels, each channel can be managed by a separate system without requiring anyone to use multiple products.
Saving effort is nice, but the real value of a unified marketing database is being able to coordinate marketing messages and relate all marketing contacts to sales results. LoopFuse hasn’t publicly revealed its approach to marketing performance measurement but definitely has something in the works. I’m particularly hoping they'll use the detailed behavior information to relate outcomes to specific marketing messages, rather than just looking at movement through purchase stages. Although stage data by itself can project future revenues, it must be tied to specific marketing programs to measure those programs’ value.
In case you’re wondering, LoopFuse is storing the new Web traffic data in denormalized tables that are separate from the operational marketing database. This enables much quicker response to ad hoc queries and, should eventually support the time-based views needed for trends and stage analytics.
For those of you keeping score at home, LoopFuse’s Roy Russo also told me that the company stores each client’s data in a separate database instance. Russo said this has proven more scalable and cheaper than the textbook Software-as-a-Service approach of commingling several clients’ data in a single instance. So far as I know, most (but not all) marketing automation vendors use same approach as LoopFuse.
Russo also said that all data in the system is accessible via standard API calls, something that’s also not always possible with competitive products. In fact, Russo said LoopFuse’s entire interface is built on using the published API, which means that technically competent clients could build alternative interfaces to embed LoopFuse data and functions within other systems. If nothing else, this gets them Geek Style Points.
Of course, no discussion of LoopFuse is complete without mentioning its freemium offer, launched last June amid considerable controversy. The company says that nearly 1,000 accounts have now signed up for this, which is impressive by any standard. No news yet on how many have converted to paid.
One side effect that I hadn't anticipated – although LoopFuse apparently did – is that agencies and consultants use the freemium to service new clients, who convert to paid when their volumes grow. This gives LoopFuse an edge in the competition for channel partners. The value of that edge is a bit uncertain, though, since an increasing number of service firms – including Pedowitz Group, Annuitas and LeftBrain Marketing – are now working with multiple marketing automation vendors.
Why Put Another $25 Million Into Marketo?
So...our friends at Marketo announced today that they've received another $25 million in venture funding. As one of their competitors snippily commented on Twitter, "Does that make the total $50M or $60M? I lost track."
I've lost track too, but it doesn't really matter. Marketo's strategy has been clear from the start: spend heavily to establish a strong position despite a relatively late start in the market. Of course, it wasn't just a matter of spending (Microsoft Zune, anyone?); they needed a solid product and good marketing as well. On all fronts, Mission Accomplished.
But the question is, what happens now? Obviously Marketo has a plan in mind and has convinced some pretty savvy investors that it makes sense. Presumably they've demonstrated a highly scalable business model that will allow them to take the latest funding and reliably transform it into growth and, eventually, into profits.
I find it a bit surprising that anyone can be $25-million-worth-of-certain about anything in such a young and volatile market, particularly because I still think B2B marketing automation will eventually be absorbed by larger CRM and/or Web content management suites. Certainly Marketo could be acquired by one of those companies but I don't think the price would be high enough to make the VCs happy. And surely they're still some time away from an IPO given what must be seriously money-losing financials to date.
I'm mostly writing this post in the hopes of seeing some helpful comments from others in the industry. Where does this all lead, both for Marketo and its competitors?
I've lost track too, but it doesn't really matter. Marketo's strategy has been clear from the start: spend heavily to establish a strong position despite a relatively late start in the market. Of course, it wasn't just a matter of spending (Microsoft Zune, anyone?); they needed a solid product and good marketing as well. On all fronts, Mission Accomplished.
But the question is, what happens now? Obviously Marketo has a plan in mind and has convinced some pretty savvy investors that it makes sense. Presumably they've demonstrated a highly scalable business model that will allow them to take the latest funding and reliably transform it into growth and, eventually, into profits.
I find it a bit surprising that anyone can be $25-million-worth-of-certain about anything in such a young and volatile market, particularly because I still think B2B marketing automation will eventually be absorbed by larger CRM and/or Web content management suites. Certainly Marketo could be acquired by one of those companies but I don't think the price would be high enough to make the VCs happy. And surely they're still some time away from an IPO given what must be seriously money-losing financials to date.
I'm mostly writing this post in the hopes of seeing some helpful comments from others in the industry. Where does this all lead, both for Marketo and its competitors?
Tuesday, November 16, 2010
Eloqua10 Offers a Much-Improved Interface and Revenue Reporting
Summary: Eloqua10 provides much-needed update to Eloqua's user interface and a new reporting infrastructure for “revenue performance management”. Neither change is revolutionary but both substantially improve the company’s competitive position within the crowded B2B marketing automation industry.
Eloqua is slated to officially release its long-promised Eloqua10 system on November 21. The main changes are an updated user interface and a new foundation for what the company calls "revenue performance management".
Let’s start with the interface. Previous versions of Eloqua were very powerful but notoriously difficult to learn and use. The company took this criticism to heart and began work more than two years ago on a new approach. The primary goal was to speed and simplify user navigation, which its research found was the root cause of 70% of user problems.
The new interface is a huge improvement. Users start on a customizable home page, which they populate from a pool of widgets for recently accessed items, favorite reports, upcoming campaigns and other information. System functions are access through tabs that align with typical user roles: campaigns for program designers, assets for content creators, contacts for segmentation managers, insight for managers and analysts, and setup for administrators.
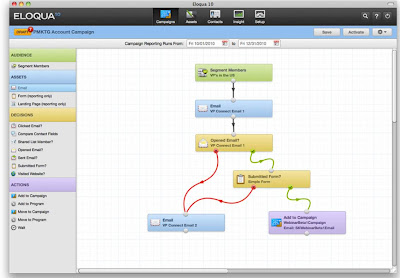
Campaign design has been wholly revamped. The old system used a classic Visio-style diagram that only an engineer could love. Users now drag campaign components into a blank canvas, and then connect and configure them. The esthetics are carefully thought out, with components grouped and color-coded by type:
- audience (segment members)
- assets (email, e-form, landing page)
- decisions (a mix of lead behaviors [clicked email, opened email, submitted form, visited Web site] and attributes [compare contact fields, shared list member, sent email])
- actions (add to campaign, add to program, move to campaign, move to program, wait)
The components are connected with squiggly lines, which probably makes no actual difference but definitely seems more friendly.
More substantively, multiple users can work on the same design simultaneously and the designs can be saved as reusable templates. It’s worth noting that the “move to campaign” action can send leads to a specific step within another campaign – not a new feature but still rare within the industry.
Users can open up assets within the campaign flow and then create or edit them. Eloqua10 introduces a Powerpoint-style design interface that lets users drag objects into place and see the changes rendered immediately. These Powerpoint-style interfaces are increasingly common among marketing automation systems, replacing the older approach of editing blocks within predefined templates. The objects can be text, images, data fields, hyperlinks or dynamic content blocks.
Eloqua10 uses the new interface to create emails, forms and landing pages – an improvement over the older version, which had different design tools for different asset types. One downside of the change is that some assets built in previous Eloqua editions will need to be modified, as will some reports.
However, old campaigns and data should transfer to the new format automatically. This reflects the fact that, once you get beneath the interface, the functionality and data structures are largely unchanged from Eloqua9.
The big exception on the data front is what Eloqua calls “revenue performance management” (RPM), which uses a new analytical database that tracks the movement of leads through stages within the buying process. This database is updated in near-real-time with operational transactions and can also receive opportunity outcomes from sales automation or other external systems.
Unfortunately, Eloqua hasn’t released the actual reports that will be provided for RPM. It does say there’s a list of sixteen, of which some already exist. Reports they’ve mentioned include: the number and ages of leads at each stage in the funnel; relation of leads delivered to sales capacity at local levels; and revenue projections based on existing leads and stage-to-stage conversion rates. I don’t know which of these are already available.
There’s also a “two way revenue attribution” report that shows revenue allocated both by “first touch” and “all touch” methods. Although I’ve previously made clear my objections to revenue attribution in general, I think this approach is relatively sensible. “First touch” reporting is useful for acquisition programs, while “all touch” shows which programs are reaching buyers even if it doesn’t show the programs’ actual influence. With apologies for damning with faint praise, I’ll say Eloqua's approach is better than the illusion of precision created by fractional attribution.
Other enhancements planned for future releases include:
- benchmark reports that let marketers compare their company’s performance with averages for similar firms
- enterprise-level security enhancements such as global log-in across multiple Eloqua instances and item-level asset security
- user interface versions in languages other than English
- a new lead scoring interface and analytics to help build more accurate scoring rules
- Webinar management
- fax, SMS and print-on-demand outputs
Eloqua has a dozen or two customers already running Eloqua10. Other clients will be converted to the system over time to ensure users are ready for the new interface and have converted whatever assets and reports are needed. The company has a suite of new training materials in place and will not charge extra for the conversion.
Eloqua is slated to officially release its long-promised Eloqua10 system on November 21. The main changes are an updated user interface and a new foundation for what the company calls "revenue performance management".
Let’s start with the interface. Previous versions of Eloqua were very powerful but notoriously difficult to learn and use. The company took this criticism to heart and began work more than two years ago on a new approach. The primary goal was to speed and simplify user navigation, which its research found was the root cause of 70% of user problems.
The new interface is a huge improvement. Users start on a customizable home page, which they populate from a pool of widgets for recently accessed items, favorite reports, upcoming campaigns and other information. System functions are access through tabs that align with typical user roles: campaigns for program designers, assets for content creators, contacts for segmentation managers, insight for managers and analysts, and setup for administrators.
Campaign design has been wholly revamped. The old system used a classic Visio-style diagram that only an engineer could love. Users now drag campaign components into a blank canvas, and then connect and configure them. The esthetics are carefully thought out, with components grouped and color-coded by type:
- audience (segment members)
- assets (email, e-form, landing page)
- decisions (a mix of lead behaviors [clicked email, opened email, submitted form, visited Web site] and attributes [compare contact fields, shared list member, sent email])
- actions (add to campaign, add to program, move to campaign, move to program, wait)
The components are connected with squiggly lines, which probably makes no actual difference but definitely seems more friendly.

More substantively, multiple users can work on the same design simultaneously and the designs can be saved as reusable templates. It’s worth noting that the “move to campaign” action can send leads to a specific step within another campaign – not a new feature but still rare within the industry.
Users can open up assets within the campaign flow and then create or edit them. Eloqua10 introduces a Powerpoint-style design interface that lets users drag objects into place and see the changes rendered immediately. These Powerpoint-style interfaces are increasingly common among marketing automation systems, replacing the older approach of editing blocks within predefined templates. The objects can be text, images, data fields, hyperlinks or dynamic content blocks.
Eloqua10 uses the new interface to create emails, forms and landing pages – an improvement over the older version, which had different design tools for different asset types. One downside of the change is that some assets built in previous Eloqua editions will need to be modified, as will some reports.
However, old campaigns and data should transfer to the new format automatically. This reflects the fact that, once you get beneath the interface, the functionality and data structures are largely unchanged from Eloqua9.
The big exception on the data front is what Eloqua calls “revenue performance management” (RPM), which uses a new analytical database that tracks the movement of leads through stages within the buying process. This database is updated in near-real-time with operational transactions and can also receive opportunity outcomes from sales automation or other external systems.
Unfortunately, Eloqua hasn’t released the actual reports that will be provided for RPM. It does say there’s a list of sixteen, of which some already exist. Reports they’ve mentioned include: the number and ages of leads at each stage in the funnel; relation of leads delivered to sales capacity at local levels; and revenue projections based on existing leads and stage-to-stage conversion rates. I don’t know which of these are already available.
There’s also a “two way revenue attribution” report that shows revenue allocated both by “first touch” and “all touch” methods. Although I’ve previously made clear my objections to revenue attribution in general, I think this approach is relatively sensible. “First touch” reporting is useful for acquisition programs, while “all touch” shows which programs are reaching buyers even if it doesn’t show the programs’ actual influence. With apologies for damning with faint praise, I’ll say Eloqua's approach is better than the illusion of precision created by fractional attribution.
Other enhancements planned for future releases include:
- benchmark reports that let marketers compare their company’s performance with averages for similar firms
- enterprise-level security enhancements such as global log-in across multiple Eloqua instances and item-level asset security
- user interface versions in languages other than English
- a new lead scoring interface and analytics to help build more accurate scoring rules
- Webinar management
- fax, SMS and print-on-demand outputs
Eloqua has a dozen or two customers already running Eloqua10. Other clients will be converted to the system over time to ensure users are ready for the new interface and have converted whatever assets and reports are needed. The company has a suite of new training materials in place and will not charge extra for the conversion.
Saturday, November 13, 2010
Rapid Insight Provides Low-Cost Options for Desktop Data Transformation and Predictive Modeling
Summary: Rapid Insight offers low-cost desktop tools for data transformation and automated regression modeling. They're a good choice for companies that need something simple yet powerful.
Predictive modeling is widely used by consumer marketers to select names for mailing lists and to decide which products to offer existing customers. These models are typically built by statisticians with tools like SAS and SPSS. In other cases, marketers can build them for themselves with automated tools like KXEN that are tightly integrated with the marketing automation system.
But most marketers still don’t have a marketing automation system or even an integrated marketing database. Nor do they have the skills to use a product like SAS. This group needs stand-alone tools to do two key things: assemble data from multiple sources, and build and execute the models themselves. (Okay, three things.)
Rapid Insight offers exactly those two (or three) capabilities in a reasonably priced package.
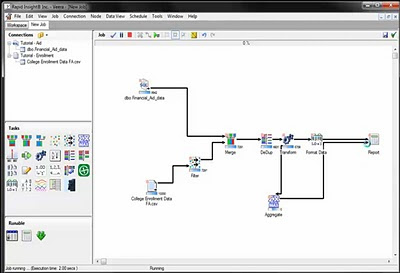
Veera is the data assembly tool. It lets users connect to most standard data sources and then define a processing flow to filter, merge, aggregate, transform and otherwise manhandle data into a form that makes it useful. Veera also provides some basic analytics including descriptive statistics (mean, median, value frequencies, etc.), cross tabs and graphing. The flow is set up as a sequence of icons with a drag-and-drop interface, which means users don’t have to learn a scripting language. Rather than go into more details, I'll just point you to the vendor's on-demand demo.
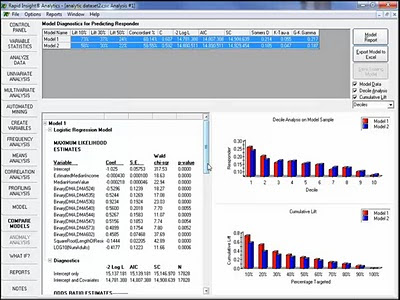
The predictive modeling tool, prosaically named Analytics, builds logistic and least squares regression models. (Logistic models predict yes/no outcomes such as whether someone will respond to a promotion; least squares models predict continuous numeric outcomes such as lifetime value.) The Analytics interface is more sequential than Veera: users get a set of tabs that lead them through the steps of loading data, selecting variables, building the model itself, assessing the results, and scoring an audience. At each step along the way, users can make their own decisions or allow the system to choose for them.
I’ve seen quite a few automated modeling systems over the years, and was impressed at how well Analytics provides users with information to understand what's happening and take control when desired. This should let the system satisfy knowledgeable statisticians looking for a productivity enhancer, as well as novices who want to rely on the system's choices. Analytics also has a good online demo.
Veera and Analytics both run in client/server or desktop configurations. They load data into system memory (RAM), which means very large projects could be problematic. The vendor says a half-million rows with a couple hundred variables is a reasonable universe to model.
The two products are sold separately. This makes sense: many companies could use a generic data assembly tool like Veera for purposes other than modeling. For example, marketers might use it to construct a multi-source marketing database for promotions or analytics.
Pricing is $3,000 for the first Veera user and $5,000 for Analytics, with discounts for additional licenses. This is quite reasonable compared with other automated modeling systems, although other products often provide more than just regression models. Annual maintenance for each product is $1,750 per license. Rapid Insights has been selling its products since 2005 and has more than 150 clients with over 200 licenses.
Predictive modeling is widely used by consumer marketers to select names for mailing lists and to decide which products to offer existing customers. These models are typically built by statisticians with tools like SAS and SPSS. In other cases, marketers can build them for themselves with automated tools like KXEN that are tightly integrated with the marketing automation system.
But most marketers still don’t have a marketing automation system or even an integrated marketing database. Nor do they have the skills to use a product like SAS. This group needs stand-alone tools to do two key things: assemble data from multiple sources, and build and execute the models themselves. (Okay, three things.)
Rapid Insight offers exactly those two (or three) capabilities in a reasonably priced package.
Veera is the data assembly tool. It lets users connect to most standard data sources and then define a processing flow to filter, merge, aggregate, transform and otherwise manhandle data into a form that makes it useful. Veera also provides some basic analytics including descriptive statistics (mean, median, value frequencies, etc.), cross tabs and graphing. The flow is set up as a sequence of icons with a drag-and-drop interface, which means users don’t have to learn a scripting language. Rather than go into more details, I'll just point you to the vendor's on-demand demo.

The predictive modeling tool, prosaically named Analytics, builds logistic and least squares regression models. (Logistic models predict yes/no outcomes such as whether someone will respond to a promotion; least squares models predict continuous numeric outcomes such as lifetime value.) The Analytics interface is more sequential than Veera: users get a set of tabs that lead them through the steps of loading data, selecting variables, building the model itself, assessing the results, and scoring an audience. At each step along the way, users can make their own decisions or allow the system to choose for them.
I’ve seen quite a few automated modeling systems over the years, and was impressed at how well Analytics provides users with information to understand what's happening and take control when desired. This should let the system satisfy knowledgeable statisticians looking for a productivity enhancer, as well as novices who want to rely on the system's choices. Analytics also has a good online demo.

Veera and Analytics both run in client/server or desktop configurations. They load data into system memory (RAM), which means very large projects could be problematic. The vendor says a half-million rows with a couple hundred variables is a reasonable universe to model.
The two products are sold separately. This makes sense: many companies could use a generic data assembly tool like Veera for purposes other than modeling. For example, marketers might use it to construct a multi-source marketing database for promotions or analytics.
Pricing is $3,000 for the first Veera user and $5,000 for Analytics, with discounts for additional licenses. This is quite reasonable compared with other automated modeling systems, although other products often provide more than just regression models. Annual maintenance for each product is $1,750 per license. Rapid Insights has been selling its products since 2005 and has more than 150 clients with over 200 licenses.
Thursday, November 04, 2010
Right On Interactive Offers Lifecycle Reporting
Summary: Right On Interactive has added great life stage reporting to the data integration and output generation features of its earlier 5Buckets product. It could supplement a traditional marketing automation system or perhaps replace one. Either way, it’s worth a look to see what you’re missing.
When I reviewed Right On Interactive in a July 2009 post, the company was selling its 5Buckets marketing software as a multi-channel output generation tool that complemented conventional marketing automation systems. Since then, Right On has expanded its functions, dropped the 5Buckets name, and repositioned itself as a marketing automation alternative focused on “customer lifecycle marketing”. It’s tempting to discuss the business strategy behind this, but I assume that you Dear Reader are a marketer and therefore it's not your problem So let’s look at what the system actually does.
We'll start with the standard marketing automation functions. These are what you need if Right On is really to substitute for one of the better-known products:
What that means in practice is users can assign contacts to lifecycle stages. This lets the system track contacts as they move through the buying, on-boarding and retention processes. Specifically, it generates reports on the number of contacts in each stage, stage-to-stage conversion rates, and average time spent in each stage. It stores each contact’s stage and score histories so it can report on trends in these metrics as well.
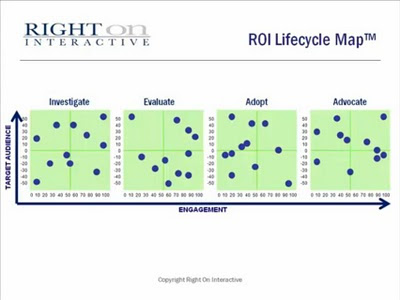
Digging a bit deeper: users define the stages by creating segmentation rules similar to standard queries. The system checks each contact against the rules, assigning the contact to the latest stage for which they qualify. The actual stages can be whatever the user wants. Right On's default set holds two lead stages (investigate and evaluate) and two customer stages (value and advocate).
But there's more. Right On creates scatter plots of contacts in each stage, using customer fit and activity scores as dimensions. The resulting “lifecycle map” is a graphic representation of the shape and quality of the company's contact inventories. The plots are interactive: users can select a group on the plot to create a new segment and can drill down to see the details of the individual contacts. They can view reports and maps for all contacts or selected segments.
Right On recognizes that its data could be used to project future business and to correlate stage changes with marketing campaigns, although it hasn’t yet built these features. Once it does, the system will go a long way to providing the stage-based marketing measurement that I’ve been arguing marketers really need. (You can also view my Marketo-sponsored Webinar on the topic.)
So where does this leave us?
I’m lukewarm about Right On as a primary marketing automation system but see great value in its lifecycle reporting. Pricing is relatively modest – starting at just under $1,700 per month for up to 50,000 contacts – so larger firms may be able to use both Right On and a conventional marketing automation product. Smaller companies will probably have to choose one or the other.
When I reviewed Right On Interactive in a July 2009 post, the company was selling its 5Buckets marketing software as a multi-channel output generation tool that complemented conventional marketing automation systems. Since then, Right On has expanded its functions, dropped the 5Buckets name, and repositioned itself as a marketing automation alternative focused on “customer lifecycle marketing”. It’s tempting to discuss the business strategy behind this, but I assume that you Dear Reader are a marketer and therefore it's not your problem So let’s look at what the system actually does.
We'll start with the standard marketing automation functions. These are what you need if Right On is really to substitute for one of the better-known products:
- data management: Right On can import files from any source, placing the data into standard structures or custom tables. Users can link the imported data to any other table, allowing complex data structures. They can also load data to the system API. This is more powerful than many marketing automation products, which are largely limited to a company, contact and activity history files.
- segmentation: users can define segments using a step-by-step query builder or by writing SQL. The query builder supports complex relationships. This is competitive with or better than standard marketing automation systems.
- campaign design: users can define campaigns with multiple “tactics” . Each tactic has its own action, schedule, metrics, documents, and start and end dates. Contacts can enter a tactic from an assigned segment or flow from a previous tactic based on their response and a user-specified waiting period. These features let Right On support multi-step campaigns although complex designs would be a challenge.
- create emails and forms: Right On uses ExactTarget for email and form creation. The integration is fairly smooth since the editing features are accessed within the Right On interface. A native solution is under development but the current approach should work for unless you have a particular aversion to ExactTarget.
- campaign actions: each tactic can execute one action. These include sending an email via Salesforce.com or ExactTarget, creating a Salesforce.com task, generating an output file, and sending emails to Foursquare friends. This covers the basic needs, although most other products also offer options such as changing data and adding a contact to a list or campaign.
- CRM integration: Right On can synchronize data with Salesforce.com and Microsoft CRM on a regular basis. It can also pull file segments and Salesforce.com campaign members as lists. This makes it roughly equivalent to other products. Right On also has a connector with location-based social network Foursquare.
- campaign reporting: users can manually enter campaign costs, target revenue, and actual revenue. The system will capture responses and use the results for response reporting, cost per response and return on investment. This is pretty standard stuff, although many other systems can also import opportunity revenue automatically from Salesforce.com – a feature still in Right On’s future.
- lead scoring: users can define separate scores for customer fit and activities. Customer fit is based on static attributes such as title while activity score is based on events such as email opens or Twitter posts. There’s also an engagement index that compares the actual activity score with the maximum possible score had the contact responded to every promotion. The scoring rules are built in the usual fashion, by assigning to points to different attribute values or different events, although the interface is nicer than most. Contacts are rescored nightly. The scores are stored on the customer record and can trigger an action to send the contact to Salesforce.com. This is on par with other products.
What that means in practice is users can assign contacts to lifecycle stages. This lets the system track contacts as they move through the buying, on-boarding and retention processes. Specifically, it generates reports on the number of contacts in each stage, stage-to-stage conversion rates, and average time spent in each stage. It stores each contact’s stage and score histories so it can report on trends in these metrics as well.
Digging a bit deeper: users define the stages by creating segmentation rules similar to standard queries. The system checks each contact against the rules, assigning the contact to the latest stage for which they qualify. The actual stages can be whatever the user wants. Right On's default set holds two lead stages (investigate and evaluate) and two customer stages (value and advocate).
But there's more. Right On creates scatter plots of contacts in each stage, using customer fit and activity scores as dimensions. The resulting “lifecycle map” is a graphic representation of the shape and quality of the company's contact inventories. The plots are interactive: users can select a group on the plot to create a new segment and can drill down to see the details of the individual contacts. They can view reports and maps for all contacts or selected segments.

Right On recognizes that its data could be used to project future business and to correlate stage changes with marketing campaigns, although it hasn’t yet built these features. Once it does, the system will go a long way to providing the stage-based marketing measurement that I’ve been arguing marketers really need. (You can also view my Marketo-sponsored Webinar on the topic.)
So where does this leave us?
I’m lukewarm about Right On as a primary marketing automation system but see great value in its lifecycle reporting. Pricing is relatively modest – starting at just under $1,700 per month for up to 50,000 contacts – so larger firms may be able to use both Right On and a conventional marketing automation product. Smaller companies will probably have to choose one or the other.
Tuesday, November 02, 2010
Oracle Buys ATG: Bad News for Marketing Automation?
So…Oracle bought ATG today for $6.00 per share or, as the press release puts it with charming nonchalance, “approximately $1.0 billion”. I can’t exactly say I told you so, since this particular pairing never crossed my mind. But if you look back at my “doughnuts and pizza slices” post on software acquisitions, it does make perfect sense. ATG is a specialist in e-commerce (the ERM doughnut in the online operations pizza slice), an area where Oracle’s traditional ERM products are weak. As my model suggests it should, ATG also encompasses online CRM and online marketing, where Oracle’s Siebel line is also a little thin.
Since Oracle is already strong in offline ERM and offline analytics, ATG leaves Oracle just one slice short of a pie. In other words, Oracle needs a Web analytics product. With Omniture, CoreMetrics and Unica already gone, only Webtrends is an option…unless Oracle gobbles up Adobe. ‘nuff said.
So much for the obvious. What I really care about is the implications for marketing systems. I’d say the ATG purchase lessens the odds of Oracle buying a marketing automation vendor. The logic is this: buying ATG suggests that Oracle, like IBM (which put Unica in its WebSphere organization), is focusing on online marketing rather than marketing automation in general. Since ATG itself provides substantial online marketing functionality, there’s a smaller gap for Oracle to fill with a separate marketing automation purchase. Nor have I forgotten that Oracle already bought marketing automation vendor Market2Lead, plugging a different set of holes.
If anything, Oracle (and IBM) need to strengthen their position in online advertising. I'd look for them to buy tools to manage banner ads, search ads, and search engine optimization. This in turn could point towards investments in content management and digital asset management systems. That also leads further away from standard marketing automation.
The day-to-day impact of all this on marketers is slight. They still need marketing automation tools to do their jobs. If anything, they’re better served by having some marketing automation vendors remain independent, since this keeps prices down and encourages competitive innovation. A less-helpful result may be to further isolate digital marketing from other channels, when what we need is to integrate them more closely. Perhaps digital marketing systems will grow to the point that they take over offline marketing as well. I hadn't expected such a role reversal, but it’s certainly possible. Just ask Oedipus. Not that that turned out so well.
Since Oracle is already strong in offline ERM and offline analytics, ATG leaves Oracle just one slice short of a pie. In other words, Oracle needs a Web analytics product. With Omniture, CoreMetrics and Unica already gone, only Webtrends is an option…unless Oracle gobbles up Adobe. ‘nuff said.
So much for the obvious. What I really care about is the implications for marketing systems. I’d say the ATG purchase lessens the odds of Oracle buying a marketing automation vendor. The logic is this: buying ATG suggests that Oracle, like IBM (which put Unica in its WebSphere organization), is focusing on online marketing rather than marketing automation in general. Since ATG itself provides substantial online marketing functionality, there’s a smaller gap for Oracle to fill with a separate marketing automation purchase. Nor have I forgotten that Oracle already bought marketing automation vendor Market2Lead, plugging a different set of holes.
If anything, Oracle (and IBM) need to strengthen their position in online advertising. I'd look for them to buy tools to manage banner ads, search ads, and search engine optimization. This in turn could point towards investments in content management and digital asset management systems. That also leads further away from standard marketing automation.
The day-to-day impact of all this on marketers is slight. They still need marketing automation tools to do their jobs. If anything, they’re better served by having some marketing automation vendors remain independent, since this keeps prices down and encourages competitive innovation. A less-helpful result may be to further isolate digital marketing from other channels, when what we need is to integrate them more closely. Perhaps digital marketing systems will grow to the point that they take over offline marketing as well. I hadn't expected such a role reversal, but it’s certainly possible. Just ask Oedipus. Not that that turned out so well.
Thursday, October 28, 2010
Entiera Competes as Enterprise Marketing Management Software
Summary: Entiera has clearly positioned itself as a marketing software vendor, selling directly or through other service providers. It competes more with enterprise marketing systems like Alterian, Aprimo and Unica than with business-to-business marketing automation products like Eloqua and Marketo.
When we last saw Entiera in my July 2009 post the company was straddling the border between managing client databases and selling on-demand marketing software. Since then the company has come down firmly on the side of being a software vendor.
Entiera still hosts databases for direct clients and provides them access through its Insight marketing automation system. But it also offers Insight to agencies and other partners for resale. The system can be installed at the client or hosted at Entiera.
Insight has been completely rewritten over the past year, although the core campaign manager still works the same. Users set up campaigns by selecting segments, then linking cells to each segment, treatments to each cell, suppressions to the cells, and deduplicaton rules to the suppressions. This works well for traditional outbound and event-triggered campaigns and supports multi-step structures.
There’s a tight integration with Exact Target www.exacttarget.com for email delivery but the system can also deliver messages via API calls to mobile and social media including Twitter and Facebook. Entiera currently integrates with Swyft Technology for real-time interactions and plans to add an alternative interface for interactive dialogs early next year.
The biggest product addition since my last review is a rich set of marketing resource management features. These include planning, budgeting, and project management with detailed schedules and task tracking. All are tightly linked with campaign set-up. These features make Entiera more clearly competitive with other enterprise marketing management systems like Aprimo, Alterian and Unica, which also stress marketing administration.
Entiera also provides substantial content management, including uploads, versioning, approvals, reusable content blocks, offer management, and automated multi-variate testing. Full digital asset management is planned for next year.
Then there’s fractional response attribution. Enteria takes a sophisticated approach, reallocating credit nightly among different marketing events depending on user-assigned factors for recency, channel weight and confidence. I’ve made clear in other posts that I consider attribution based on such arbitrary assumptions to be dangerous. But I’ve no doubt that Enteria’s clients are pleased to have it available. **sigh** Fractional allocation is another common feature among enterprise marketing products.
Although Entiera is a true on-demand system, each client has a custom database. This distinguishes it from most business-to-business marketing automation systems (Eloqua, Marketo, Genius, etc.), whose clients use a standard data structure and sometimes a shared database instance. Also unlike the B2B systems, Entiera doesn’t let users build landing pages into campaigns, although it will be adding that feature next year. It does support leading scoring and CRM data synchronization.
Entiera pricing is aimed at the middle and upper ends of the market, starting around $10,000 per month. Fees can be based on database size or on message volume. Insight is currently used by about 25 clients and is resold by a number of marketing agencies.
When we last saw Entiera in my July 2009 post the company was straddling the border between managing client databases and selling on-demand marketing software. Since then the company has come down firmly on the side of being a software vendor.
Entiera still hosts databases for direct clients and provides them access through its Insight marketing automation system. But it also offers Insight to agencies and other partners for resale. The system can be installed at the client or hosted at Entiera.
Insight has been completely rewritten over the past year, although the core campaign manager still works the same. Users set up campaigns by selecting segments, then linking cells to each segment, treatments to each cell, suppressions to the cells, and deduplicaton rules to the suppressions. This works well for traditional outbound and event-triggered campaigns and supports multi-step structures.
There’s a tight integration with Exact Target www.exacttarget.com for email delivery but the system can also deliver messages via API calls to mobile and social media including Twitter and Facebook. Entiera currently integrates with Swyft Technology for real-time interactions and plans to add an alternative interface for interactive dialogs early next year.
(Speaking of third party integration, Entiera makes extensive use of outside technology, including the Vertica columnar database, Alteryx data integration, Jaspersoft reporting, Birst business intelligence and KXEN predictive. The company has been especially delighted with Vertica’s performance and cost-effectiveness.)
The biggest product addition since my last review is a rich set of marketing resource management features. These include planning, budgeting, and project management with detailed schedules and task tracking. All are tightly linked with campaign set-up. These features make Entiera more clearly competitive with other enterprise marketing management systems like Aprimo, Alterian and Unica, which also stress marketing administration.
Entiera also provides substantial content management, including uploads, versioning, approvals, reusable content blocks, offer management, and automated multi-variate testing. Full digital asset management is planned for next year.
Then there’s fractional response attribution. Enteria takes a sophisticated approach, reallocating credit nightly among different marketing events depending on user-assigned factors for recency, channel weight and confidence. I’ve made clear in other posts that I consider attribution based on such arbitrary assumptions to be dangerous. But I’ve no doubt that Enteria’s clients are pleased to have it available. **sigh** Fractional allocation is another common feature among enterprise marketing products.
Although Entiera is a true on-demand system, each client has a custom database. This distinguishes it from most business-to-business marketing automation systems (Eloqua, Marketo, Genius, etc.), whose clients use a standard data structure and sometimes a shared database instance. Also unlike the B2B systems, Entiera doesn’t let users build landing pages into campaigns, although it will be adding that feature next year. It does support leading scoring and CRM data synchronization.
Entiera pricing is aimed at the middle and upper ends of the market, starting around $10,000 per month. Fees can be based on database size or on message volume. Insight is currently used by about 25 clients and is resold by a number of marketing agencies.
Thursday, October 21, 2010
CMO Council: CMOs and CIOs Are Not Aligned
Summary: a CMO Council survey shows that CMOs and CIOs agree they need to cooperate, but disagree on how well they're doing and what their roles should be. Both sides need to work harder to close an increasingly-unacceptable gap. This affects marketing automation vendors too, since they sell to both sides.
The CMO Council and Accenture Interactive recently released a study Aligning the CMO and CIO to Achieve Agile Intelligent Marketing based on parallel surveys of about 300 members of each group. The free 32-page summary provides a detailed analysis and commentary. Key conclusions are:
"While customers have now broadly and deeply embraced new digital and social media channels of engagement, interaction and transaction, most senior marketers and IT executives admit their companies lack a clear understanding of how customers are using their channels and are not highly prepared to leverage those channels. Meanwhile, the relationship between marketing and IT too often remains dysfunctional, with marketers complaining about insufficient support from enterprise IT departments, and IT complaining about marketing departments that forge forward with technology implementations without IT involvement. While marketing believes customer intelligence is critical to competitive advantage, it is struggling to gain IT support and budget for better integration and mining of disparate customer data that is often isolated and under-utilized across organizational silos.
"Yet, there is also significant common ground on which to build a new era of cooperation and synchronization between marketing and IT. There is mutual agreement on the central role technology now plays in defining the customer experience, delivering strategic customer insight, and in reaching and engaging a digitally driven marketplace."
The CMO Council generously shared the detailed data with me. This provided hours of amusement as I recrunched the numbers from my own perspective. I’ve included some of results below with their permission (although of course the interpretations are my own). If you care about these issues, it’s well worth $199 to see the rest.
CMOs and CIOs agree they need to work together, and why. Both cited customer insight and analytics as top reasons to work together. Marketing measurement and ROI rank lower, although CMOs care about them more than CIOs seem to think.

They also agree they have much work to do:
- only 3% of CMOs and 1% of CIOs said their company was heavily committed and invested in interactive digital marketing strategies”
- just 8% of CMOs and 6% of CIOs said they had fully integrated online and offline analytics
But the relationship is far from perfect.
CMOs and CIOs often blame each other for failures.
- Many more CMOs than CIOs said they had “problems or challenges implementing marketing solutions or IT projects to further marketing effectiveness” (64% of CMOs vs. 48% of CIOs). That is, marketers are less happy that IT realizes.
- CMOs blamed failure on lack of IT priority, lack of IT expertise, IT keeping marketing “out of the loop” and IT resistance to solution sourcing.
- CIOs blamed failure on marketing bypassing IT and working directly with the vendor and marketing taking control and isolating IT.
- Both groups did agree on other causes including insufficient funding, lack of time and technical resources, solution complexity and lack of management support.

CMOs and CIOs select tools separately.
- CIOs were much more likely to base selections on consultation with technical groups (enterprise IT, web, contact center and back office) and somewhat more dependent on vendor interactions at conferences.
- CMOs rely more on consultations within marketing, including internal meetings, strategic planning and audits and assessments. But the CIO figures are still fairly high: CIOs are not ignoring marketing’s input, although marketing may be largely ignoring IT.
- Incidentally, both groups cited online research much more often than industry analysts, peer groups or formal needs assessments and RFPs. This reinforces the common notion that online information is increasingly more important for marketing system buyers.

CIOs are less in tune with digital marketing efforts than they think – and CMOs know it:
- 76% of CIOs felt their CIO understood marketing objectives and requirements, but just 54% of CMOs felt their CIO understood marketing needs.
- CMOs were nearly twice as likely as CIOs to feel their company is growing its digital marketing spend (35% of CMOs vs 20% of CIOs).
- CMOs were also more likely to think their firm was aggressively adopting new marketing technologies or was testing new solutions (combined 39% of CMOs vs. 28% of CIOs). CIOs were more likely to think the company was still at the evaluation stage or not a priority (combined 24% of CMOs vs. 34% of CIOs).
- CIOs were much more likely than CMOs to feel that IT was playing a major leadership role in digital marketing strategy. But the majority of both groups also listed the CMO as a digital marketing leader. Near-majorities also credited senior management.

CMOs and CIOs disagree on the CIO's job.
- CMOs take a limited view of the CIO's role. Mostly, they want the CIOto handle the mechanics of data and integration.

- CIOs agreed that better data was their first priority, but otherwise felt they should focus on new types of systems and interactions. They show particular interest in social media.

CMOs and CIOs have different views of spending, too.
- CMOs and CIOs agreed that they spend the most on operational activities including email, Web analytics and CRM. But...
- CMOs reported much more spending on campaign management, marketing platforms and marketing analytics than CIOs. Either the CIOs aren’t paying attention to marketing systems or the CMOs are spending money outside of IT. Or both.
- CMOs also reported more spending on email and search marketing than CIOs. That makes a bit more sense: much of that money doesn’t flow through IT.
- CIOs reported more infrastructure spending such as content management, data warehouse, customer interactions and call centers than CMOs. That one also makes more sense since many of those items fall outside of marketing.

Two more observations on spending:
- Reported spending on multi-channel campaign management and integrated marketing platforms (27% and 23% for CMOs, respectively) was much higher than spending on enterprise marketing management or marketing resource management (both at 10%). I personally think they are close to the same thing, so I’m guessing this is mostly about labels. But perhaps enterprise marketing management is truly a broader and more advanced concept – suggesting there is indeed a large untapped market.
- Spending on marketing performance analytics (22% of CMOs) was more common than spending on ROI modeling and performance measurement (11%) . Could be another labeling issue – or maybe ROI is more specific, more demanding and less common. You decide.
The CMO Council and Accenture Interactive recently released a study Aligning the CMO and CIO to Achieve Agile Intelligent Marketing based on parallel surveys of about 300 members of each group. The free 32-page summary provides a detailed analysis and commentary. Key conclusions are:
"While customers have now broadly and deeply embraced new digital and social media channels of engagement, interaction and transaction, most senior marketers and IT executives admit their companies lack a clear understanding of how customers are using their channels and are not highly prepared to leverage those channels. Meanwhile, the relationship between marketing and IT too often remains dysfunctional, with marketers complaining about insufficient support from enterprise IT departments, and IT complaining about marketing departments that forge forward with technology implementations without IT involvement. While marketing believes customer intelligence is critical to competitive advantage, it is struggling to gain IT support and budget for better integration and mining of disparate customer data that is often isolated and under-utilized across organizational silos.
"Yet, there is also significant common ground on which to build a new era of cooperation and synchronization between marketing and IT. There is mutual agreement on the central role technology now plays in defining the customer experience, delivering strategic customer insight, and in reaching and engaging a digitally driven marketplace."
The CMO Council generously shared the detailed data with me. This provided hours of amusement as I recrunched the numbers from my own perspective. I’ve included some of results below with their permission (although of course the interpretations are my own). If you care about these issues, it’s well worth $199 to see the rest.
CMOs and CIOs agree they need to work together, and why. Both cited customer insight and analytics as top reasons to work together. Marketing measurement and ROI rank lower, although CMOs care about them more than CIOs seem to think.

They also agree they have much work to do:
- only 3% of CMOs and 1% of CIOs said their company was heavily committed and invested in interactive digital marketing strategies”
- just 8% of CMOs and 6% of CIOs said they had fully integrated online and offline analytics
But the relationship is far from perfect.
CMOs and CIOs often blame each other for failures.
- Many more CMOs than CIOs said they had “problems or challenges implementing marketing solutions or IT projects to further marketing effectiveness” (64% of CMOs vs. 48% of CIOs). That is, marketers are less happy that IT realizes.
- CMOs blamed failure on lack of IT priority, lack of IT expertise, IT keeping marketing “out of the loop” and IT resistance to solution sourcing.
- CIOs blamed failure on marketing bypassing IT and working directly with the vendor and marketing taking control and isolating IT.
- Both groups did agree on other causes including insufficient funding, lack of time and technical resources, solution complexity and lack of management support.

CMOs and CIOs select tools separately.
- CIOs were much more likely to base selections on consultation with technical groups (enterprise IT, web, contact center and back office) and somewhat more dependent on vendor interactions at conferences.
- CMOs rely more on consultations within marketing, including internal meetings, strategic planning and audits and assessments. But the CIO figures are still fairly high: CIOs are not ignoring marketing’s input, although marketing may be largely ignoring IT.
- Incidentally, both groups cited online research much more often than industry analysts, peer groups or formal needs assessments and RFPs. This reinforces the common notion that online information is increasingly more important for marketing system buyers.

CIOs are less in tune with digital marketing efforts than they think – and CMOs know it:
- 76% of CIOs felt their CIO understood marketing objectives and requirements, but just 54% of CMOs felt their CIO understood marketing needs.
- CMOs were nearly twice as likely as CIOs to feel their company is growing its digital marketing spend (35% of CMOs vs 20% of CIOs).
- CMOs were also more likely to think their firm was aggressively adopting new marketing technologies or was testing new solutions (combined 39% of CMOs vs. 28% of CIOs). CIOs were more likely to think the company was still at the evaluation stage or not a priority (combined 24% of CMOs vs. 34% of CIOs).
- CIOs were much more likely than CMOs to feel that IT was playing a major leadership role in digital marketing strategy. But the majority of both groups also listed the CMO as a digital marketing leader. Near-majorities also credited senior management.

CMOs and CIOs disagree on the CIO's job.
- CMOs take a limited view of the CIO's role. Mostly, they want the CIOto handle the mechanics of data and integration.

- CIOs agreed that better data was their first priority, but otherwise felt they should focus on new types of systems and interactions. They show particular interest in social media.

CMOs and CIOs have different views of spending, too.
- CMOs and CIOs agreed that they spend the most on operational activities including email, Web analytics and CRM. But...
- CMOs reported much more spending on campaign management, marketing platforms and marketing analytics than CIOs. Either the CIOs aren’t paying attention to marketing systems or the CMOs are spending money outside of IT. Or both.
- CMOs also reported more spending on email and search marketing than CIOs. That makes a bit more sense: much of that money doesn’t flow through IT.
- CIOs reported more infrastructure spending such as content management, data warehouse, customer interactions and call centers than CMOs. That one also makes more sense since many of those items fall outside of marketing.

Two more observations on spending:
- Reported spending on multi-channel campaign management and integrated marketing platforms (27% and 23% for CMOs, respectively) was much higher than spending on enterprise marketing management or marketing resource management (both at 10%). I personally think they are close to the same thing, so I’m guessing this is mostly about labels. But perhaps enterprise marketing management is truly a broader and more advanced concept – suggesting there is indeed a large untapped market.
- Spending on marketing performance analytics (22% of CMOs) was more common than spending on ROI modeling and performance measurement (11%) . Could be another labeling issue – or maybe ROI is more specific, more demanding and less common. You decide.
Tuesday, October 19, 2010
Alsa Marketing Adds Multi-Language Capabilities to Low-Cost Marketing Automation
Summary: Alsa Marketing is a late entry to small business marketing automation. They support multiple languages, which should gain them some business. Otherwise, though, it will be tough for them to compete with better-established players.
It’s harder every day for a new company to enter the business-to-business marketing automation industry. Of the three classic competitive strategies – low price, great service and innovative products – there are plenty of low price options and leading vendors work aggressively to help their clients succeed. This leaves unique features as the only viable strategy for a new firm.*
Alsa Marketing, a Montreal-based firm that launched its product in June, has one significant differentiator: it supports multiple languages (French, Spanish and English) in its user interface and in lead profiles. So far as I know, this is unique in the lower end of the market (Alsamarketing starts at $750 per month for up to 10,000 leads and 25,000 emails). Not surprisingly, the company’s 35 or so clients are mostly Canadian and European.
Alsa has some other unusual features. These include support for multivariate tests on landing pages (but not emails); automated posting of Jigsaw and social media data into lead profiles; fractional revenue attribution; and SugarCRM synchronization. These can all be hard to find, although they’re certainly not unique. (As I discussed last week, I’m no fan at all of fractional attribution – but Alsa tells me their clients like having it as an option. **sigh**)
The system also provides a solid set of standard capabilities. Users can import lists, compose and send emails, build landing pages, execute multi-step event-triggered campaigns, monitor Web behaviors, score leads, exchange data with SugarCRM or (soon) Salesforce.com, and run reports. Also can capture results of Google Adwords campaigns and has a URL-shortener to track traffic from social media. The user interface and functionality are perfectly nice but not exceptional.
Alsa also provides prebuilt templates for standard campaign workflows. The vendor argues that this removes a critical roadblock for many marketers, who have trouble building such workflows on their own. I’m not sure it’s really a big issue and, in any case, other vendors provide similar help. In general, Alsa says it has concentrated on helping its initial clients to use the system successfully: again, while this is clearly important (and might save some consulting fees), similar help is available from its competitors.
At best, superior support could built Alsa a small but loyal customer base. Multi-language might open a larger market, at least until competitors match it. I wish Alsa nothing but the best and will be interested to see how things work out.
It’s harder every day for a new company to enter the business-to-business marketing automation industry. Of the three classic competitive strategies – low price, great service and innovative products – there are plenty of low price options and leading vendors work aggressively to help their clients succeed. This leaves unique features as the only viable strategy for a new firm.*
Alsa Marketing, a Montreal-based firm that launched its product in June, has one significant differentiator: it supports multiple languages (French, Spanish and English) in its user interface and in lead profiles. So far as I know, this is unique in the lower end of the market (Alsamarketing starts at $750 per month for up to 10,000 leads and 25,000 emails). Not surprisingly, the company’s 35 or so clients are mostly Canadian and European.
Alsa has some other unusual features. These include support for multivariate tests on landing pages (but not emails); automated posting of Jigsaw and social media data into lead profiles; fractional revenue attribution; and SugarCRM synchronization. These can all be hard to find, although they’re certainly not unique. (As I discussed last week, I’m no fan at all of fractional attribution – but Alsa tells me their clients like having it as an option. **sigh**)
The system also provides a solid set of standard capabilities. Users can import lists, compose and send emails, build landing pages, execute multi-step event-triggered campaigns, monitor Web behaviors, score leads, exchange data with SugarCRM or (soon) Salesforce.com, and run reports. Also can capture results of Google Adwords campaigns and has a URL-shortener to track traffic from social media. The user interface and functionality are perfectly nice but not exceptional.
Alsa also provides prebuilt templates for standard campaign workflows. The vendor argues that this removes a critical roadblock for many marketers, who have trouble building such workflows on their own. I’m not sure it’s really a big issue and, in any case, other vendors provide similar help. In general, Alsa says it has concentrated on helping its initial clients to use the system successfully: again, while this is clearly important (and might save some consulting fees), similar help is available from its competitors.
At best, superior support could built Alsa a small but loyal customer base. Multi-language might open a larger market, at least until competitors match it. I wish Alsa nothing but the best and will be interested to see how things work out.
Friday, October 15, 2010
Fractional Response Attribution is Worse Than Nothing
Summary: Should companies apply fractional revenue attribution when more sophisticated methods are impractical? I think not: it gives inaccurate results that could result in bad decisions. Better to avoid financial measures at all if you can't do them properly.
I spent most of the past week in San Francisco at overlapping conferences for the Direct Marketing Association and Marketo. My Marketo presentation was based on the marketing measurement white paper I recently wrote for them, which argues that measurement should be based on tracking buyers through stages in the purchase process. One corollary to this is not attributing fractions of revenue among different marketing touches. The analogy I’m currently using is baking a cake – it doesn’t make sense to assign partial credit for the final flavor to different ingredients: the recipe as a whole either works or doesn’t. Only testing can determine the impact of making changes.
Given this mindset, I was more than a little surprised to attend a DMA panel discussion where two of the more sophisticated marketing measurement vendors described their systems as providing fractional attribution. Both vendors also offer more advanced methods and both made clear that they used such methods in appropriate situations. But they seemed to feel that when adequate data is not available, fractional attribution is better than nothing.
I certainly understand their attitude. Many of the business-to-business marketers at the Marketo conference have exactly this problem: their data volumes are too small to accurately measure the incremental impact of most marketing programs. The best suggestion I can make is that they run whatever tests their volumes make practical. I’d further suggest that testing may actually be more practical than they realize if they actively and creatively look for opportunities to do it.
But, again, the vendors on my panel knew this. The examples they gave were situations where companies had previously attributed all marketing revenue to the “last touch” before an actual purchase or other conversion event. They used fractional attribution to help people (marketers and those who fund them) see that other contacts also contribute to those final results. The practical goal was to justify funding for early-stage programs that such as search engine optimization and display advertising that precede that “last touch” itself.
I’m all in favor of recognizing that early-stage contacts have value. But I still feel that assigning a fundamentally arbitrary financial value to those contacts is a mistake. The main danger is that people who don’t know any better may use these numbers to allocate marketing funds to the more “productive” uses. Such figures are not accurate enough to support such decisions.
I’d rather use non-monetary measures such as correlations between different kinds of touches and ultimate results. These can highlight the connections between early and later touches without providing financial values that are easily misapplied. Maybe this is just wishful thinking, but perhaps refusing to provide unreliable financial metrics will even highlight the need for tests that can provide truly meaningful ones—thus helping marketers to make the necessarily investments.
So what do you think: is fractional revenue attribution of reasonable compromise or a harmful distraction? Let me know your thoughts.
I spent most of the past week in San Francisco at overlapping conferences for the Direct Marketing Association and Marketo. My Marketo presentation was based on the marketing measurement white paper I recently wrote for them, which argues that measurement should be based on tracking buyers through stages in the purchase process. One corollary to this is not attributing fractions of revenue among different marketing touches. The analogy I’m currently using is baking a cake – it doesn’t make sense to assign partial credit for the final flavor to different ingredients: the recipe as a whole either works or doesn’t. Only testing can determine the impact of making changes.
Given this mindset, I was more than a little surprised to attend a DMA panel discussion where two of the more sophisticated marketing measurement vendors described their systems as providing fractional attribution. Both vendors also offer more advanced methods and both made clear that they used such methods in appropriate situations. But they seemed to feel that when adequate data is not available, fractional attribution is better than nothing.
I certainly understand their attitude. Many of the business-to-business marketers at the Marketo conference have exactly this problem: their data volumes are too small to accurately measure the incremental impact of most marketing programs. The best suggestion I can make is that they run whatever tests their volumes make practical. I’d further suggest that testing may actually be more practical than they realize if they actively and creatively look for opportunities to do it.
But, again, the vendors on my panel knew this. The examples they gave were situations where companies had previously attributed all marketing revenue to the “last touch” before an actual purchase or other conversion event. They used fractional attribution to help people (marketers and those who fund them) see that other contacts also contribute to those final results. The practical goal was to justify funding for early-stage programs that such as search engine optimization and display advertising that precede that “last touch” itself.
I’m all in favor of recognizing that early-stage contacts have value. But I still feel that assigning a fundamentally arbitrary financial value to those contacts is a mistake. The main danger is that people who don’t know any better may use these numbers to allocate marketing funds to the more “productive” uses. Such figures are not accurate enough to support such decisions.
I’d rather use non-monetary measures such as correlations between different kinds of touches and ultimate results. These can highlight the connections between early and later touches without providing financial values that are easily misapplied. Maybe this is just wishful thinking, but perhaps refusing to provide unreliable financial metrics will even highlight the need for tests that can provide truly meaningful ones—thus helping marketers to make the necessarily investments.
So what do you think: is fractional revenue attribution of reasonable compromise or a harmful distraction? Let me know your thoughts.
Friday, October 08, 2010
Doughnuts and Pizza Slices: Analyzing Consolidation and Competition Among Software Vendors
Summary: One way to understand consolidation and competitive trends affecting marketing software is to look at systems across several dimensions: how closely they relate to customers; whether they are operational or analytical; and whether they support online or offline activities. Combining these provides interesting insights into who competes with whom and what they're likely to do next.
On Wednesday, IBM announced formal completion of its acquisition of Unica. On Thursday, the New York Times reported speculation that Microsoft could buy Adobe.
Coincidence? Yeah, probably. And probably nonsense to boot.
But from my admittedly marketing-centric view of the world, Microsoft / Adobe makes more sense than one might think, as did IBM / Unica. Here’s how I think of things:
If you consider software applications from the view of customer relationships, they form a set of nested circles -- or perhaps a pile of doughnuts seen from above. At the center is the universe of potential buyers. The applications that reach these anonymous masses are applications that manage advertising.
The next circle holds marketing applications, which deal with both identified and unidentified prospects. The circle surrounding that holds CRM systems, which deal with identified customers as well as prospects. Surrounding that are ERM systems, which encompass both customer-facing and back-office applications. You can further extend the model by adding a circle for software platforms (operating systems and databases) and another for hardware.

Each larger circle can include the functions within the smaller circles. Thus, a marketing automation system like Unica or Aprimo includes advertising management; CRM systems like Salesforce.com provide marketing automation; and ERM suites like SAP and Oracle include CRM. Operating systems, databases and hardware support them all. In practice, the specialists in each field tend to be better than components of the larger surrounding suites: this is the essence of a “best of breed” strategy.
So far so good. But a system's relation to customers is just one dimension. Systems can also be classified functionally as operational or analytical, and as dealing with online or offline activities. If you combine those in a two by two matrix, this results in four classes of systems, which correspond nicely to real-world products: online operations (Web site management and ecommerce), online analysis (Web analytics), offline operations (traditional ERM systems) and offline analysis (business intelligence).

Things get really interesting (to me, at least) when you combine these two models. A complete solution for any application includes all four of the matrix quadrants: operations, analytics, online and offline components. So the application's "doughnut" extends through each quadrant.

The other way to look at this is to treat all systems within each quadrant as a unit. Keeping with our junk food theme, let's call those pizza slices.

I find the combination of doughnuts and pizza slices a useful way to think about the relationships among industry vendors. Functional systems tend to start out as pizza slices: general solutions that cut across all applications within their quadrant. Applications typically start out as doughnut quarters: that is, specialists within a single quadrant, usually operations. For example, CRM systems started out mostly as offline operational solutions for call centers and sales automation; marketing automation began largely as campaign management for offline contacts by direct mail and telemarketing.
Functional vendors expand first by thickening features within their original quadrant and then by spreading into adjacent quadrants. Thus, offline operational systems can grow either by adding offline analytics or by adding online operations; online analytical systems can grow by adding online operations or offline analytics; etc.
Applications vendors expand by first completing their own doughnut and then moving into adjacent doughnuts, typically inward: ERM vendors beef up their CRM capabilities (e.g., Oracle buys Siebel Systems); CRM vendors add marketing capabilities (Pegasystems purchases Portrait Software); and marketing automation vendors add advertising support such as planning and marketing resource management (Unica buys MarketingCentral). It’s harder to move in the other direction, since the vendors in the surrounding circles are typically larger.
What makes IBM / Unica so interesting is that IBM has been buying pizza slices (CoreMetrics, Sterling Commerce, Cognos, SPSS) while Unica is a doughnut. The combination is tough to digest. Do you slice up Unica’s various components and reassign them to the Web operations, Web analytics and business intelligence units? Or do you keep the doughnut together and enrich it with parts of the other products? What happens to that little offline operations slice (direct mail, call center, etc.)? And do you fill in the center (advertising support) with something more substantial?
Adobe started as a specialized application for offline operations (printing), which would make it a thin pizza slice. It has grown by thickening its offline features and, more recently, by expanding into adjacent slices: online operations and, with the Omniture acquisition, online analytics. It has also narrowed its focus towards the center of the pizza, on the marketing and advertising doughnuts.
This narrowed focus is what makes Adobe an interesting partner for Microsoft. Microsoft doesn’t have much of the Web analytics slice and would like to strengthen its position in the marketing and advertising doughnuts. The blogger who called the Microsoft rumor “nonsense” suggested that Google is a more likely partner, basically as an anti-Apple move. That makes some sense, but Google already lives in the online marketing and advertising slice, so Adobe would just thicken their presence. Google would like to complete the offline portions of its marketing and advertising doughnuts, but Adobe doesn’t help much there. And I don’t think Google has much interest in moving into Adobe’s other slices.
The "junk food chart" offers quite a few other insights. One is the opportunity for many marketing automation vendors to grow by adding more advertising support -- a major weakness in most products. Another is the likelihood that Web site vendors and Web analytics vendors will themselves push more actively into marketing automation. A third would be the challenge that big online vendors will face in growing if they don't more into offline operations like CRM. You can also plot individual companies on the chart to see how they stack up against competitors both within and outside their existing markets. It's interesting stuff and a great way to work up an appetite.
On Wednesday, IBM announced formal completion of its acquisition of Unica. On Thursday, the New York Times reported speculation that Microsoft could buy Adobe.
Coincidence? Yeah, probably. And probably nonsense to boot.
But from my admittedly marketing-centric view of the world, Microsoft / Adobe makes more sense than one might think, as did IBM / Unica. Here’s how I think of things:
If you consider software applications from the view of customer relationships, they form a set of nested circles -- or perhaps a pile of doughnuts seen from above. At the center is the universe of potential buyers. The applications that reach these anonymous masses are applications that manage advertising.
The next circle holds marketing applications, which deal with both identified and unidentified prospects. The circle surrounding that holds CRM systems, which deal with identified customers as well as prospects. Surrounding that are ERM systems, which encompass both customer-facing and back-office applications. You can further extend the model by adding a circle for software platforms (operating systems and databases) and another for hardware.

Each larger circle can include the functions within the smaller circles. Thus, a marketing automation system like Unica or Aprimo includes advertising management; CRM systems like Salesforce.com provide marketing automation; and ERM suites like SAP and Oracle include CRM. Operating systems, databases and hardware support them all. In practice, the specialists in each field tend to be better than components of the larger surrounding suites: this is the essence of a “best of breed” strategy.
So far so good. But a system's relation to customers is just one dimension. Systems can also be classified functionally as operational or analytical, and as dealing with online or offline activities. If you combine those in a two by two matrix, this results in four classes of systems, which correspond nicely to real-world products: online operations (Web site management and ecommerce), online analysis (Web analytics), offline operations (traditional ERM systems) and offline analysis (business intelligence).

Things get really interesting (to me, at least) when you combine these two models. A complete solution for any application includes all four of the matrix quadrants: operations, analytics, online and offline components. So the application's "doughnut" extends through each quadrant.

The other way to look at this is to treat all systems within each quadrant as a unit. Keeping with our junk food theme, let's call those pizza slices.

I find the combination of doughnuts and pizza slices a useful way to think about the relationships among industry vendors. Functional systems tend to start out as pizza slices: general solutions that cut across all applications within their quadrant. Applications typically start out as doughnut quarters: that is, specialists within a single quadrant, usually operations. For example, CRM systems started out mostly as offline operational solutions for call centers and sales automation; marketing automation began largely as campaign management for offline contacts by direct mail and telemarketing.
Functional vendors expand first by thickening features within their original quadrant and then by spreading into adjacent quadrants. Thus, offline operational systems can grow either by adding offline analytics or by adding online operations; online analytical systems can grow by adding online operations or offline analytics; etc.
Applications vendors expand by first completing their own doughnut and then moving into adjacent doughnuts, typically inward: ERM vendors beef up their CRM capabilities (e.g., Oracle buys Siebel Systems); CRM vendors add marketing capabilities (Pegasystems purchases Portrait Software); and marketing automation vendors add advertising support such as planning and marketing resource management (Unica buys MarketingCentral). It’s harder to move in the other direction, since the vendors in the surrounding circles are typically larger.
What makes IBM / Unica so interesting is that IBM has been buying pizza slices (CoreMetrics, Sterling Commerce, Cognos, SPSS) while Unica is a doughnut. The combination is tough to digest. Do you slice up Unica’s various components and reassign them to the Web operations, Web analytics and business intelligence units? Or do you keep the doughnut together and enrich it with parts of the other products? What happens to that little offline operations slice (direct mail, call center, etc.)? And do you fill in the center (advertising support) with something more substantial?
Adobe started as a specialized application for offline operations (printing), which would make it a thin pizza slice. It has grown by thickening its offline features and, more recently, by expanding into adjacent slices: online operations and, with the Omniture acquisition, online analytics. It has also narrowed its focus towards the center of the pizza, on the marketing and advertising doughnuts.
This narrowed focus is what makes Adobe an interesting partner for Microsoft. Microsoft doesn’t have much of the Web analytics slice and would like to strengthen its position in the marketing and advertising doughnuts. The blogger who called the Microsoft rumor “nonsense” suggested that Google is a more likely partner, basically as an anti-Apple move. That makes some sense, but Google already lives in the online marketing and advertising slice, so Adobe would just thicken their presence. Google would like to complete the offline portions of its marketing and advertising doughnuts, but Adobe doesn’t help much there. And I don’t think Google has much interest in moving into Adobe’s other slices.
The "junk food chart" offers quite a few other insights. One is the opportunity for many marketing automation vendors to grow by adding more advertising support -- a major weakness in most products. Another is the likelihood that Web site vendors and Web analytics vendors will themselves push more actively into marketing automation. A third would be the challenge that big online vendors will face in growing if they don't more into offline operations like CRM. You can also plot individual companies on the chart to see how they stack up against competitors both within and outside their existing markets. It's interesting stuff and a great way to work up an appetite.
Thursday, September 30, 2010
Four Must-Have Metrics for Marketing Measurement
Summary: Four critical metrics tell you most of what you need to show the value of your marketing efforts and to optimize your results. And, here's a funny picture.
There’s still time to sign up for my October 7 Webinar on stage-based marketing measurement (sponsored by Marketo and hosted by the American Marketing Association). During my extensive, um, research, I was very pleased to find the following picture to illustrate the concept of stages:

I like this picture both because it's amusing (a major priority) and also because it illustrates that stage definitions are constructed, not discovered. (I suppose the proper science is that evolutionary stages are objective facts, in which case our monkey friend in the photo simply has it wrong. But the deeper point still stands: whether it’s evolutionary stages or purchasing stages, someone imposes conceptual order on the jumble of reality.)*
If the picture isn't enough reason to attend, the Webinar will also present four essential metrics of stage-based marketing measurement. (Quick review: stage-based measurement tracks the ability of marketing programs to move leads through stages in the purchase process. This is more meaningful than attributing some fraction of the final revenue directly to each program. I’ll cover this in the Webinar and also discuss it in a recent whitepaper Winning the Marketing Measurement Marathon).
In case you can’t attend the Webinar, I thought I’d share the four metrics here.
1. Marketing ROI.
Purpose: to show the company’s return on its marketing investment.
Inputs: marketing costs and marketing-related revenue.
Metric: return on investment (= revenue / cost)
Comment: As with any ROI calculation, the trick here is to determine which costs are associated with which revenues. It’s always hard for marketers to know which revenues they helped to generate, but I’ll assume a database or digital environment that identifies the treatments applied to individuals and their actual purchases. In this situation, marketing ROI is calculated by summing all marketing costs for a cohort of customers sharing some common feature such as original source, acquisition date range or first purchase date. Note that a meaningful calculation must also include spending on people who never purchase, so a cohort based on purchase dates must somehow include non-buyers.
2. Program ROI
Purpose: measure the relative performance of individual marketing programs.
Inputs: incremental marketing cost, incremental revenue
Metric: incremental ROI
Comment: Obviously the key word here is “incremental”. Marketing programs exist in the context of other activities that influence buyer behavior. The only thing you can really measure is the incremental change that occurs when a particular program is added or removed from the mix. Combined with incremental costs, this gives an incremental ROI for the program. Spending more on high ROI programs and less on low ROI programs is how marketers optimize their results. Remember, though, that ROI is just one part of the equation. In practice, marketers must balance it against considerations such as revenue goals and marketing budgets.
Incremental measurement requires formal tests that compare performance of two similar groups which differ only in whether they received a particular program. These tests can cover any type of program, including nurture programs that don’t acquire new names. Proper measurement must track through the end of the buying cycle, since a program’s impact on early stages might vanish or even be reversed at later stages. One common example: a free introductory offer that yields higher initial response but doesn't add to the final number of paying customers.
3. Stage Results
Purpose: understand movement of leads through the buying stages
Inputs: marketing costs per stage, conversions (= number of leads that move to the next stage), conversion time (= time in stage before conversion to next stage; a.k.a. velocity), lead inventory (=number of leads in each stage)
Metrics: conversion rate, cost per conversion, average conversion time
Comment: These statistics describe how leads are moving from one stage to the next. The information is used to project future behaviors, to identify problem stages, to track changes in stage performance, and to compare the effects of marketing programs. Where leads in different cohorts (based on original source, acquisition date, marketing treatments, etc.) behave differently, statistics should be gathered separately for each cohort.
One statistic you can't calculate is the ROI for stage investments. This is counter-intuitive: stage ROI should be possible because you're making investments at each stage and the investments produce leads with higher values. But in fact the aggregate value of a cohort of leads remains the same as they move through the stages; all that happens is that unproductive (i.e., valueless) leads drop out. That is, even though the value per lead increases, there is no increase in the value of all leads combined. Without a value change, you can’t calculate a return on investment.
(Actually, there is a bit of value change as leads move through the stages because leads in later stages will need less additional investment to reach the final sale. But the expected revenue for the cohort stays constant. Of course, to the extent that a particular marketing program creates an incremental change in total value, this can be measured like any other program ROI.)
4. Revenue Forecast
Purpose: estimate future period revenues (by week, month, quarter, etc.) from the current lead inventory.
Inputs: lead inventory per stage, conversion rate per stage, conversion time per stage
Metric: revenue forecast by period
Comment: Revenue projections are among the most critical of corporate statistics. The stage-based approach allows more accurate projections of revenue over time, starting with the current lead inventory and known stage statistics. If the projections can distinguish marketing-generated leads from other leads, they can also give a concrete measure of the value that marketing has provided to the organization. If leads from different cohorts behave differently, the projections need to use separate assumptions for each group.
_____________________________________________________
* Platonists and creationists, with their respective theories of absolute Forms and divinely-created immutable species, might argue that species actually do have an independent existence. They're wrong.
There’s still time to sign up for my October 7 Webinar on stage-based marketing measurement (sponsored by Marketo and hosted by the American Marketing Association). During my extensive, um, research, I was very pleased to find the following picture to illustrate the concept of stages:

I like this picture both because it's amusing (a major priority) and also because it illustrates that stage definitions are constructed, not discovered. (I suppose the proper science is that evolutionary stages are objective facts, in which case our monkey friend in the photo simply has it wrong. But the deeper point still stands: whether it’s evolutionary stages or purchasing stages, someone imposes conceptual order on the jumble of reality.)*
If the picture isn't enough reason to attend, the Webinar will also present four essential metrics of stage-based marketing measurement. (Quick review: stage-based measurement tracks the ability of marketing programs to move leads through stages in the purchase process. This is more meaningful than attributing some fraction of the final revenue directly to each program. I’ll cover this in the Webinar and also discuss it in a recent whitepaper Winning the Marketing Measurement Marathon).
In case you can’t attend the Webinar, I thought I’d share the four metrics here.
1. Marketing ROI.
Purpose: to show the company’s return on its marketing investment.
Inputs: marketing costs and marketing-related revenue.
Metric: return on investment (= revenue / cost)
Comment: As with any ROI calculation, the trick here is to determine which costs are associated with which revenues. It’s always hard for marketers to know which revenues they helped to generate, but I’ll assume a database or digital environment that identifies the treatments applied to individuals and their actual purchases. In this situation, marketing ROI is calculated by summing all marketing costs for a cohort of customers sharing some common feature such as original source, acquisition date range or first purchase date. Note that a meaningful calculation must also include spending on people who never purchase, so a cohort based on purchase dates must somehow include non-buyers.
2. Program ROI
Purpose: measure the relative performance of individual marketing programs.
Inputs: incremental marketing cost, incremental revenue
Metric: incremental ROI
Comment: Obviously the key word here is “incremental”. Marketing programs exist in the context of other activities that influence buyer behavior. The only thing you can really measure is the incremental change that occurs when a particular program is added or removed from the mix. Combined with incremental costs, this gives an incremental ROI for the program. Spending more on high ROI programs and less on low ROI programs is how marketers optimize their results. Remember, though, that ROI is just one part of the equation. In practice, marketers must balance it against considerations such as revenue goals and marketing budgets.
Incremental measurement requires formal tests that compare performance of two similar groups which differ only in whether they received a particular program. These tests can cover any type of program, including nurture programs that don’t acquire new names. Proper measurement must track through the end of the buying cycle, since a program’s impact on early stages might vanish or even be reversed at later stages. One common example: a free introductory offer that yields higher initial response but doesn't add to the final number of paying customers.
3. Stage Results
Purpose: understand movement of leads through the buying stages
Inputs: marketing costs per stage, conversions (= number of leads that move to the next stage), conversion time (= time in stage before conversion to next stage; a.k.a. velocity), lead inventory (=number of leads in each stage)
Metrics: conversion rate, cost per conversion, average conversion time
Comment: These statistics describe how leads are moving from one stage to the next. The information is used to project future behaviors, to identify problem stages, to track changes in stage performance, and to compare the effects of marketing programs. Where leads in different cohorts (based on original source, acquisition date, marketing treatments, etc.) behave differently, statistics should be gathered separately for each cohort.
One statistic you can't calculate is the ROI for stage investments. This is counter-intuitive: stage ROI should be possible because you're making investments at each stage and the investments produce leads with higher values. But in fact the aggregate value of a cohort of leads remains the same as they move through the stages; all that happens is that unproductive (i.e., valueless) leads drop out. That is, even though the value per lead increases, there is no increase in the value of all leads combined. Without a value change, you can’t calculate a return on investment.
(Actually, there is a bit of value change as leads move through the stages because leads in later stages will need less additional investment to reach the final sale. But the expected revenue for the cohort stays constant. Of course, to the extent that a particular marketing program creates an incremental change in total value, this can be measured like any other program ROI.)
4. Revenue Forecast
Purpose: estimate future period revenues (by week, month, quarter, etc.) from the current lead inventory.
Inputs: lead inventory per stage, conversion rate per stage, conversion time per stage
Metric: revenue forecast by period
Comment: Revenue projections are among the most critical of corporate statistics. The stage-based approach allows more accurate projections of revenue over time, starting with the current lead inventory and known stage statistics. If the projections can distinguish marketing-generated leads from other leads, they can also give a concrete measure of the value that marketing has provided to the organization. If leads from different cohorts behave differently, the projections need to use separate assumptions for each group.
_____________________________________________________
* Platonists and creationists, with their respective theories of absolute Forms and divinely-created immutable species, might argue that species actually do have an independent existence. They're wrong.
Subscribe to:
Posts (Atom)