TL;DR: you can play the game here.
I’ve recently been running workshops to help companies plan deployment of their Customer Data Platforms. Much of the discussion revolves around defining use cases and, in particular, deciding which to deliver first. This requires balancing the desire to include many data sources in the first release of the system against the desire to deliver value quickly. The challenge is to find an optimal deployment sequence that starts with the minimum number of sources needed for an important use case and then incrementally adds new sources that support new use cases. I’ve always found that an intriguing problem although I’ll admit few others have shared my fascination.
As coronavirus forces most marketers to work from home, I’ve also been pondering ways to deliver information that are more engaging than traditional Webinars and, ahem, blog posts. The explosion of interest in games in particular seems to offer an opportunity for creative solutions.
So it was fairly natural to conceive of a game that addresses the deployment sequence puzzle. The problem seems like a good candidate: governed by a few simple dynamics that become interestingly complex when they interact. The core dynamic is that one new data source may support new multiple use cases, while different combinations of sources support different use cases. This means you could calculate the impact of different sequences to compare their value.
Of course, some use cases are worth more than others and some sources cost more to integrate than others; you also have to consider the availability of the CDP itself, of central analytical and campaign systems, and of delivery system that can use the outputs. But for game purposes, you could simplify matters to assume that each system costs the same and each use case has the same value. This still leaves in place the core dynamic of balancing the cost of adding one system with the value of enabling multiple use cases with that system.
To make things even more interesting and realistic, you could add the fact that some use cases are possible with a few systems but become more valuable as new systems come online. It might be that their data adds value – say, by making predictions more accurate – or because they enable delivery of messages in more channels.
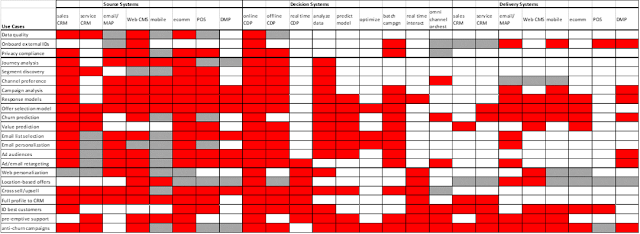
In the end, then, you end up with a matrix that crosses a list of systems (data sources, CDPs, analytics, campaigns management, and delivery systems) against a list of use cases. Each cell in the matrix indicates whether a particular system is essential or optional for a particular use case. Value for any given period would include: the one-time cost of adding a new system; the recurring cost of operating active systems, and the value generated by each active use case. That use case value would include a base value earned by running the use case plus incremental value from each optional system. Using red to indicate required systems and grey to indicate optional systems, the matrix looks like this:
The game play would then be to select system one at a time, calculate the value generated as the period revenue, and then repeat until you run out of systems to add. Sometimes you’d select systems because they made a new use case possible, sometimes you’d select because they added optional value to already-active use cases, and sometimes you’d select a system to make possible more use cases in the future. Fun!
I then showed this to a professional game designer, whose response was “you may have found the least fun form factor imaginable: the giant data-filled spreadsheet. I'm kind of impressed.”
Ouch, but he had a point. I personally found the game to be playable using a computer to do the calculations but others also found it impenetrable. A version using physical playing cards was clearly impossible.
So, after much pondering, I came up with a vastly simplified version that collapsed the 19 systems in the original model into three categories, and only required each use case to have a specified number of systems in each category. I did keep the distinction between required and optional systems, since that has a major impact on the effectiveness of different solutions. I also simplified the value calculations by removing system cost, since that would be the same across all solutions so long as you add one system per period.
The result was a much simpler matrix, with just six columns (required and optional counts for each of the three system types) and the same number of rows per use case (22 in the example). I built this into a spreadsheet that does the scoring calculations and stores results for each period, so the only decision players need to make in any turn is which of the three system types to select. Even my game designer grudgingly allowed that it “made sense pretty quickly” and was “kinda fun”. That’s about all the enthusiasm I can hope for, I suspect.
I’ve put a working version of this in a Google spreadsheet that you can access here.
Go ahead and give it a play – it just takes a few minutes to complete once you grasp how it works (put a ‘1’ in the column for each period to select the class of system to add during that period). Most of the spreadsheet is write-protected but there’s a leaderboard if you can beat my high score of 1,655.
Needless to say, I’m interested in feedback. You can reach me through LinkedIn here.
Although this started as a CDP planning exercise, it’s really a martech stack building game, something I think we can all agree the world desperately needs right now. I also have worked out a physical card game version that would have a number of additional features to make games more interesting and last longer. Who wants to play?
Monday, April 27, 2020
Subscribe to:
Post Comments (Atom)


No comments:
Post a Comment