I’ve finally had time to work up the vendor scores based on the 150+ RFP questions I distributed back in September. The result will be one of those industry landscape charts that analysts seem pretty much obliged to produce. I have never liked those charts because so many buyers consider only the handful of anointed “leaders”, even though one of the less popular vendors might actually be a better fit. This happens no matter how loudly analysts warn buyers not to make that mistake.
On the other hand, such charts are immensely popular. Recognizing that buyers will use the chart to select products no matter what I tell them, I settled on dimensions that are directly related to the purchase process:
- product fit, which assesses how well a product matches buyer needs. This is a combination of features, usability, technology, and price.
- vendor strength, which assesses a vendor’s current and future business position. This is a combination of company size, client base, and financial resources.
These are conceptually quite different from the dimensions used in the Gartner and Forrester reports* , which are designed to illustrate competitive position. But I’m perfectly aware that only readers of this blog will recognize the distinction. So I've also decided to create three versions of the chart, each tailored to the needs of different types of buyers.
In the interest of simplicity, my three charts will address marketers at small, medium and big companies. The labels are really short-hand for the relative sophistication and complexity of user requirements. But if I explicitly used a scale from simple to sophisticated, no one would ever admit that their needs were simple -- even to themselves. I've hoping the relatively neutral labels will encourage people to be more realistic. In practice, we all know that some small companies are very sophisticated marketers and some big companies are not. I can only hope that buyers will judge for themselves which category is most appropriate.
The trick to producing three different rankings from the same set of data is to produce three sets of weights for the different elements. Raab Associates’ primary business for the past two decades has been selecting systems, so we have a well-defined methodology for vendor scoring.
Our approach is to first set the weights for major categories and then allocate weights within those categories. The key is that the weights must add to 100%. This forces trade-offs first among the major categories and then among factors within each category. Without the 100% limit, two things happen:
- everything is listed as high priority. We consistently found that if you ask people to rate features as "must have" "desirable" and "not needed", 95% of requirements are rated as “must have”. From a prioritization standpoint, that's effectively useless.
- categories with many factors are overweighted. What happens is that each factor gets at least one point, giving the category a high aggregate total. For example, category with five factors has a weight of at least five, while a category with 20 factors has a weight of 20 or more.
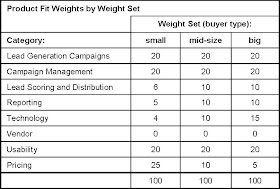
The following table shows the major weights I assigned. The heaviest weight goes to lead generation and nurturing campaigns – a combined 40% across all buyer types. I weighted pricing much more heavily for small firms, and gabe technology, lead scoring and technology heavier weights at larger firms. You’ll notice that Vendor is weighted at zero in all cases: remember that these are weights for product fitness scores. Vendor strength will be scored on a separate dimension.

I think these weights are reasonable representations of how buyers think in the different categories. But they’re ultimately just my opinion. So I also created a reality check by looking at vendors who target the different buyer types.
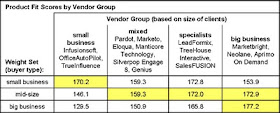
This was possible because the matrix asked vendors to describe their percentage of clients in small, medium and large businesses. (The ranges were under $20 million, $20 million to $500 million, and over $500 million annual revenue.) Grouping vendors with similar percentages of small clients yielded the following sets:
- small business (60% or more small business clients): Infusionsoft, OfficeAutoPilot, TrueInfluence
- mixed (33-66% small business clients): Pardot, Marketo, Eloqua, Manticore Technology, Silverpop, Genius
- specialists (15%-33% small business): LeadFormix, TreeHouse Interactive, SalesFUSION
- big clients (fewer than 15% small business): Marketbright, Neolane, Aprimo On Demand
(I also have data from LoopFuse, Net Results, and HubSpot, but didn’t have the client distribution for the first two. I excluded HubSpot because it is a fundamentally different product.)
If my weights were reasonable, two things should happen:
- vendors specializing in each client type should have the highest scores for that client type (that is, small business vendors have higher scores than big business vendors using the small business weights.)
- vendors should have their highest scores for their primary client type (that is, small business vendors should have higher scores with small business weights than with big business weights).
As the table below shows, that is pretty much what happened:

So far so good. But how did I know I’d assigned the right weights to the right features?
I was particularly worried about the small business weights. These showed a relatively small difference in scores across the different vendor groups. In addition, I knew I had weighted price heavily. In fact, it turned out that if I took price out of consideration, the other vendor groups would actually have higher scores than the small business specialists. This couldn't be right: the other systems are really too complicated for small business users, regardless of price.

Clearly some adjustments were necessary. I'll describe how I handled this in tomorrow's post.
_______________________________________________________
* “ability to execute” and “completeness of vision” for Gartner, “current offering”, “market presence” and “strategy” for Forrester.
Great stuff, David. I've been chewing on it a couple of weeks.
ReplyDeleteOne early pop-out was that in my experience, Usability takes on different importance at different company size bands. It makes sense when you realize that larger companies employ demand gen specialists, people who can learn more complex interfaces because they have such a focused job role within their organization. On the contrary, small businesses often employ marketing generalists, people for whom UI may be of paramount importance (or perhaps secondary to price), since a more difficult to use system won't see the adoption that a simpler one will.
Thanks for the food for thought.
I totally agree Steve. Small businesses also need systems with a broader scope because the same person will be doing different jobs -- email, Web analytics, search ads, maybe even sales and customer service -- that would be split among different people at a larger firm. Learning multiple systems and switching among them all day long would be brutal. Of course, the functionality doesn't need to be as deep.
ReplyDeleteI am not a marketer but a small business owner that chose my demand gen software due to user interface, it is much more complex than I can use but I at least get the flow better than some of the other vendors I looked at.
ReplyDelete